Why Cable Is the Place to Look for Trading Opportunities

Uncertainty is a theme I’ve been writing about quite a lot lately. There’s plenty of it about, and it creates volatility, and as a result, trading opportunities for us. We will have an unusual state of affairs over the next three months until the result of the Brexit referendum is known by the electorate, and not just by the politicians, who will obviously have timed it for a ‘desirable’ outcome.
It’s a bit of an astronomical phenomenon where we have a lot of planets lining up in that the US presidentials are causing uncertainty, Brexit here, and the migrant crisis is affecting Europe. The UK and US should be producing some interesting moves on the £/$ exchange rates.
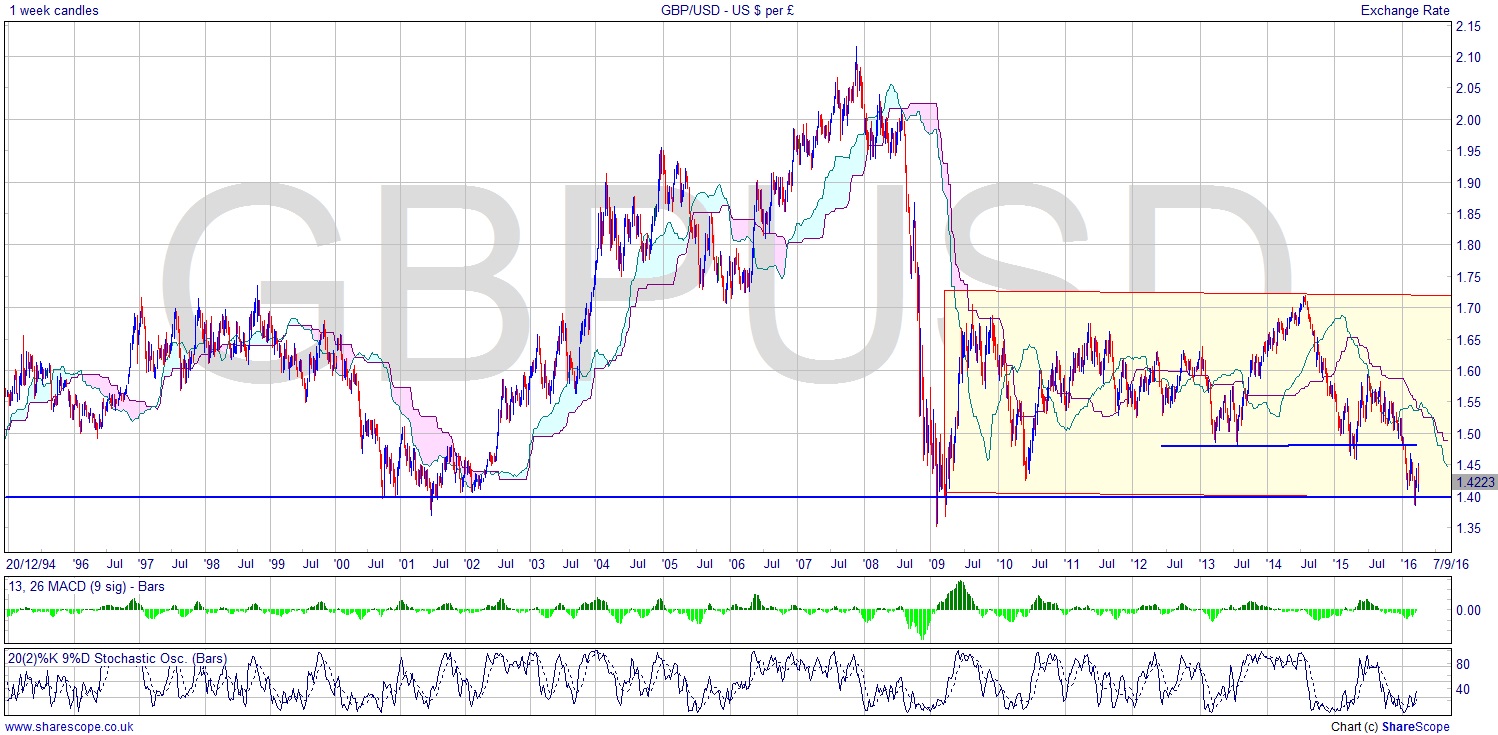
I wrote about Cable (GBPUSD) in January and looked at the long-term picture and suggested it may well be time to short cable. There had been a break of the support level at around $1.48, and I said that $1.40 is the significant level which, if broken, could lead to huge downside. It’s certainly flirting with that support level and it has dipped into the upper $1.30s. It’s interesting as the spectre of the UK leaving the EU – which the US has said it doesn’t support, and of course may mean the exact opposite given politicians are Oscar winning liars – has weakened the pound a little, but the spectre of Trump in the White House has probably stemmed the tide. So Trump may well be the reason that we’re not below $1.40 and falling fast. He may actually be more effective at controlling exchange rates than fiscal policy.
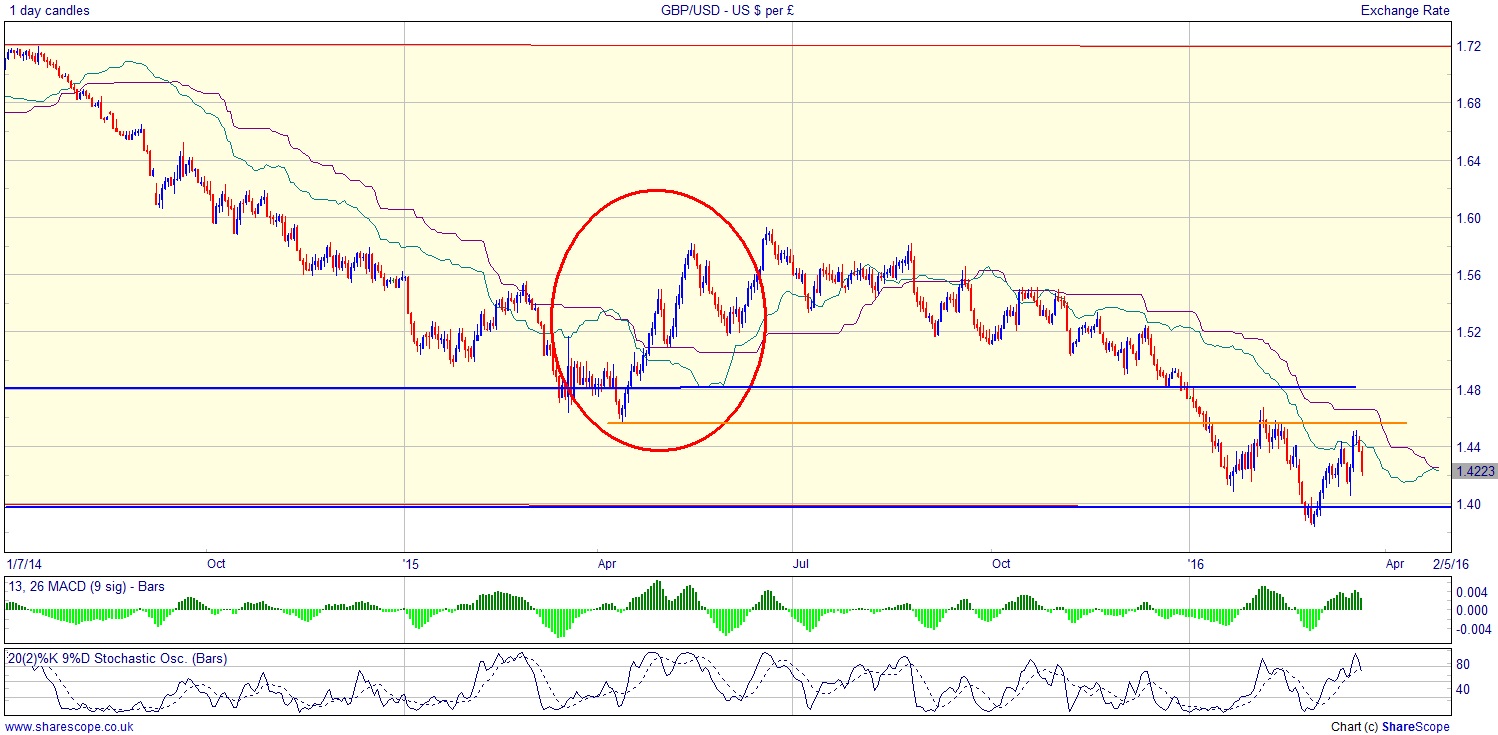
I’ve zoomed in on the daily chart to examine more closely what’s happening. We can see the MACD and Stochastic are both a bit toppy. The price action has failed at the cloud bottom, although it has made a couple of higher lows. One trick to get a heads up ahead of the pack on what’s going to happen could be to look for a divergence between the price and the MACD. They’re pretty much in tandem right now, but a good example of what to look for happened last April. I’ve circled the price so you can see the higher lows set against a MACD with lower highs. A sign that the rally would end – and it did just that. A great tool for trade management that one.
Of course as time passes, the cloud will inevitably be coming lower, and that means the price could shimmy into it and out the other side. This would make the chart less bearish, but with no change in trend as such. I’ve marked the line in orange that picks out the support level from last April, which has now produced resistance just a couple of bars ago. Looking back a couple of weeks to when it pushed a little through that level, it only really did it with the tails, not what we call the ‘body’ of the candle, which determine open and close levels. In other words it pushed through during the day but couldn’t stay there. That’s quite an interesting point. It could mean that is a significant S/R level, and that being the case it would keep the price all the closer to the crucial $1.40 level with less room to move.
If you’re going on holiday to the US you might want to bag some travel dollars sooner rather than later.
Comments (0)