Zak’s Daily Round-Up: CCL, KGF, SKY, AFC and HUR

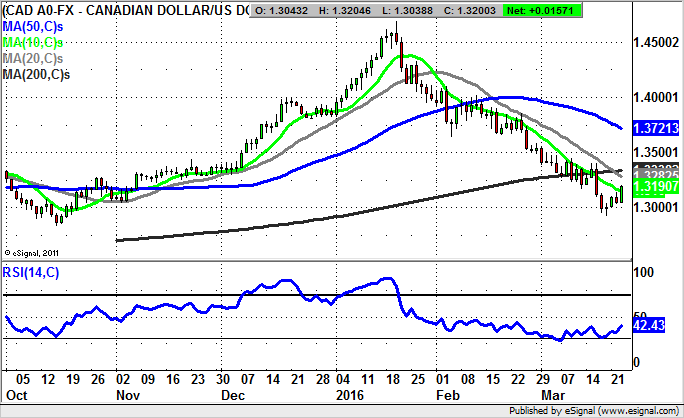
Market Direction: Canadian Dollar above 1.30 Targets 1.35
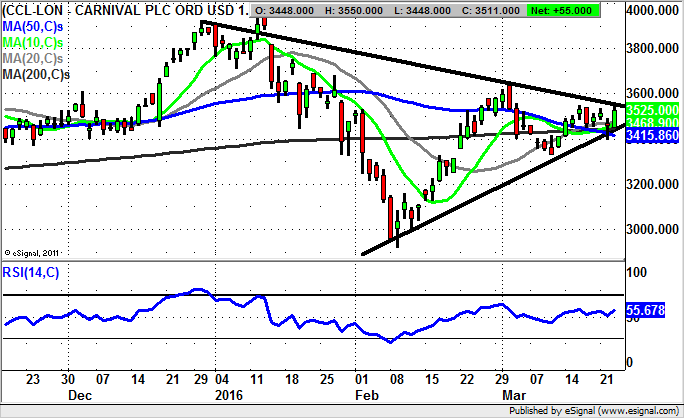
Carnival (CCL): Triangle Break Leads to 3,800p
Cruise operator Carnival has basically been an inverse play on the Crude Oil price in recent months, but with an added spin of factors. These have included, in no particular order, the Zika virus, terror threats and recession fears. Although it has to be admitted that for this particular sub sector the grey Pound would appear to be particularly resilient. The present position on the daily chart shows the way that the latest recovery for Crude Oil back from below $30 to above $42 has dampened the price action, but it could very well be the case that for the time being the retracement has run its course. This is said on the basis that we are set for a triangle breakout through 3,550p. The suggestion currently is that as little as an end of day close back above a December resistance line at this level could be enough to trigger a retest of the main 2016 resistance zone above 3,800p. The timeframe on such a move is regarded as being as soon as the next 4-6 weeks, especially if we close above the trendline by the end of this shortened Easter Holiday week.
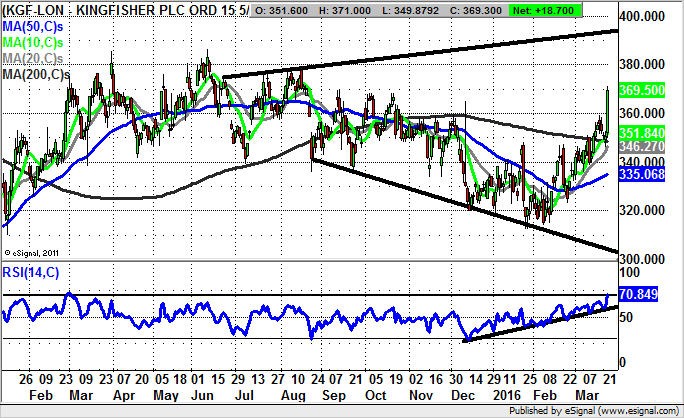
Kingfisher (KGF): Above 200 Day Line Targets 390p
There has been an interesting divergence between the fundamental profits drop of 21% for DIY group Kingfisher, and the sharp rebound for the share price. This suggests that despite the company’s somewhat optimistic tone with its mooted re-jig of the business, we are looking at an acceptance that change is good here. The reason for this interpretation is the way that there has been a very strong rebound for the stock from just above the level of the 200 day moving average at 348.5p. The fact that even in the aftermath of the initial dip for the stock there was no ability by the bears to get the stock back to the 200 day line suggests that there has been a rebound in sentiment towards the shares, if not a full blooded bear squeeze. All of this would allow us to conclude that provided there is no end of day close back below the initial March 359p peak, we could be treated to at least a journey as high as the top of a broadening triangle drawn on the daily chart from as long ago as June last year. The timeframe on the upside scenario is seen as being as soon as the next 4-6 weeks.
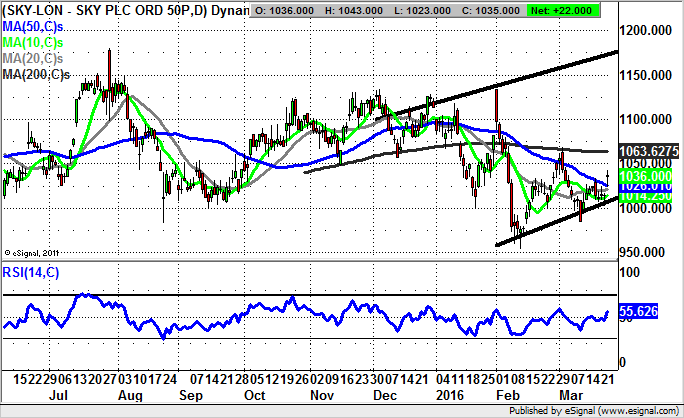
Sky (SKY): Higher Support above 1,000p Targets 1,130p
One of the key charting points for many stocks and indices over the post August 2015 period has been the low of that month, which in many cases was something of a selling climax point. This has meant that subsequently we have had this pivotal zone to trade against and judge the performance of the market in question by. In the case of Sky it can be seen how the low of the late summer was 982p, with the price action delivering a couple of bear traps from below this price for the start of 2016. However, what is noticeable for late March is the way that there has been a higher low put in above 1,000p at 1,002p. The assumption to make now is that provided there is no end of day close back below this second March floor the upside here is expected to be a return towards the main February resistance zone just above 1,134p – perhaps as soon as the end of April.
Small Caps Focus
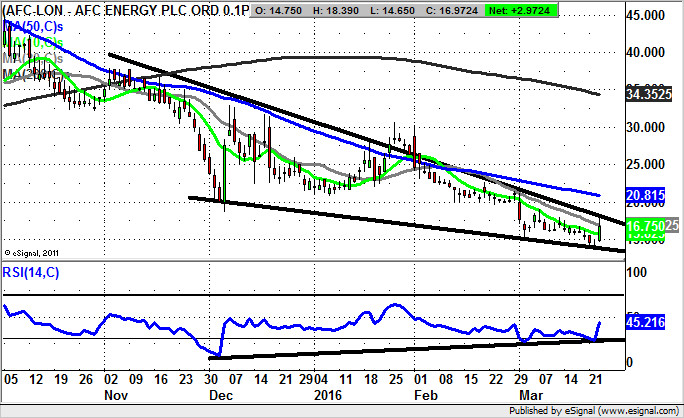
AFC Energy (AFC): A Wedge Break Could Lead Back to 30p
Given what a great bullish prospect AFC Energy was in Q2 and Q3 last year, it was truly disappointing to see the shares slip away so persistently in H2 2015. However, the latest 20% jump for the stock suggests that the bulls may get another bite at the cherry, which is said on the basis of the rebound from within a bullish falling wedge formation. The resistance line of the wedge is running at 17p, with the shares backed by an extended uptrend line in the RSI window in place from as long ago as the beginning of December. This line should be a leading indicator on fresh upside. The assumption to make now is that as little as an end of day close back above the November resistance line at 17p could be enough to snap the shares up for a retest of the main post January peaks at 30p plus. The timeframe on such a move is regarded as being as soon as the next 4-6 weeks given the way that the shares have been caged up in a relative small range of late.
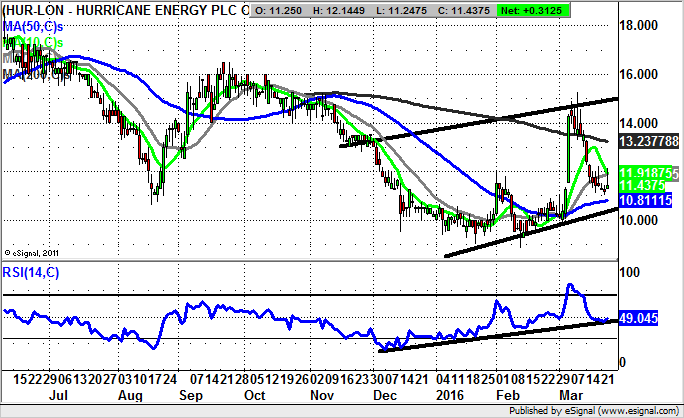
Hurricane Energy (HUR): W Shaped Reversal Targets 15p Again
What can be seen on the daily chart of Hurricane Energy over the post December period is the way that there has been not only an extended base in place towards the 9p zone, but a W shaped reversal in the wake of a final February bear trap from just below the 9p level. The other extra positive kicker was the early March gap to the upside, an event which underlined the positive credentials of this potential recovery situation. The position now is that we are most likely being presented with an opportunity to go long towards the floor of a rising trend channel from at 10.5p. Above this number targets the March resistance at 15p as soon as the end of next month.
Comments (0)