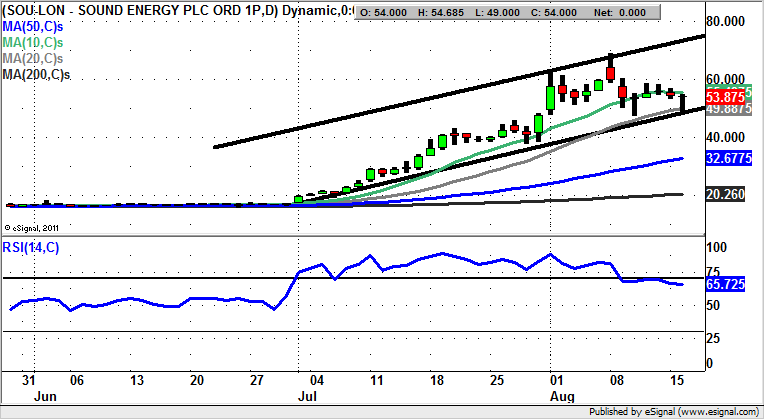
Chart of the Day: Sound Energy

Sound Energy has been one of the small cap phenomena of the year to date, but it is ironic that the big bull run here took quite a while to get off the ground.
Sound Energy (SOU): Rising Trend Channel Targets 70p
The enigma of Sound Energy and its recent mega rally is the way that the shares took so long to establish support. This was first below 15p at the end of last year, and then towards this level for the best part of six months in 2016. Clearly, from a technical perspective the rule is the longer the base building process, the greater the rally. Therefore, on this basis, the process of getting the bull run underway was an exhaustive one. The big breakthrough of course came through for July, with only a cursory test of former resistance from early February at 19.5p as new support a couple of days after the breakout. Since then we have been treated to surprisingly consistent progress within a rising trend channel from the beginning of last month. This has its support line projection running at 49p, also today’s intraday low. What is helpful is the way there has been a hammer candle off this number, which suggests Sound is ready for a new leg to the upside. An end of day close above the 10 day moving average at 55p can be regarded as a possible cue to a journey to the 70p zone over the following 2-4 weeks.

Comments (0)