Zak’s Daily Round-Up: ECM, OCDO, ZPLA, PANR and TUNG

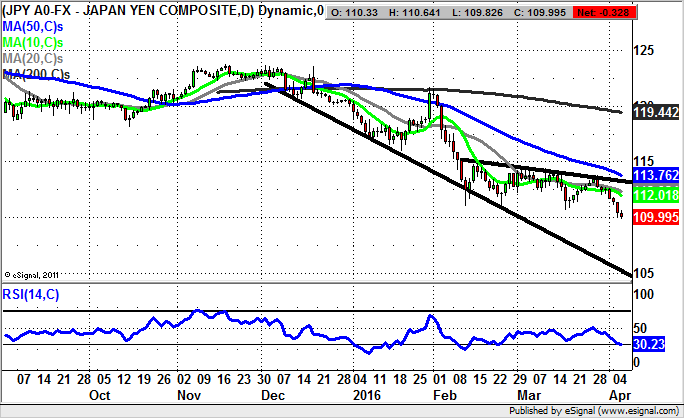
Market Direction: Dollar/Yen below 111 Points Towards 106
Electrocomponents (ECM): 320p Technical Destination
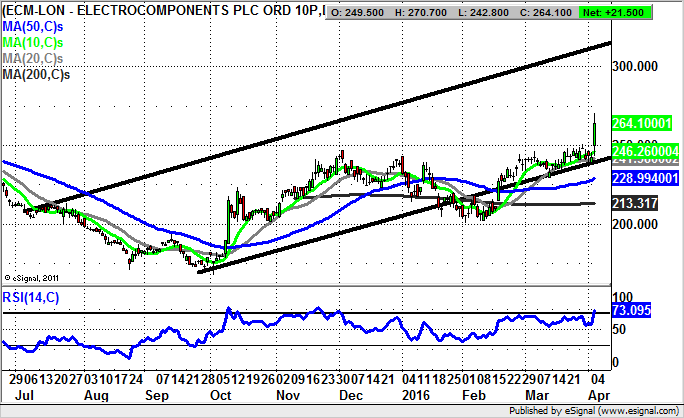
Just for a change we are looking at the mid caps in place of the larger companies in today’s daily roundup, although the selection still includes companies with chunky market capitalisations. First up is Electrocomponents, where it can be seen that it is possible to draw a rising trend channel on the daily chart from as long ago as July last year.
What is interesting over the near term is the way that not only have we had a major break out through the former 250p resistance zone in place since December, but also how support over recent weeks has come in at or above the 20 day moving average at 241p. All of this goes to suggest that at least while there is no end of day close back below the 20 day line, the stock should make good on the recent breakout, with a journey towards the top of last year’s trend channel.
This has its resistance line projection currently pointing at 320p, with the timeframe on such a move seen as being as soon as the next 4 to 6 weeks. In the meantime any weakness back towards 250p is regarded as a buying opportunity, especially as this would cool off the currently overbought RSI at 73/100. Also noticeable is the way that the shares have had the RSI oscillator above neutral 50 since the middle of February, and dips for this indicator have remained above the midline ever since.
Ocado (OCDO): Triangle Target at 430p
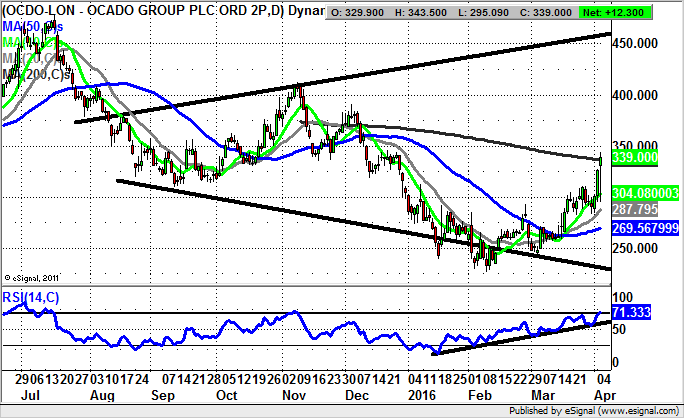
What can be seen on the daily chart of Ocado over the past year and more is the way that we have been treated to a relatively complex example of price action and price patterns. The highlight at the moment is the latest clearance of the 200 day moving average now at 336p. The assumption to make is that a weekly close above this feature in a couple of days’ time could be all that it takes to not only underline the prospect of a new and significant bull move, but also a possible retest of the best levels of last year, which is something that would have been almost unthinkable even as recently as a few weeks ago. On this basis the upside here is regarded as being back towards the top of a one year broadening triangle in place since as long ago as this time last year. The timeframe on the notional 430p target is as soon as the next 1-2 months.
Zoopla (ZPLA): Trend Channel Pointing at 325p
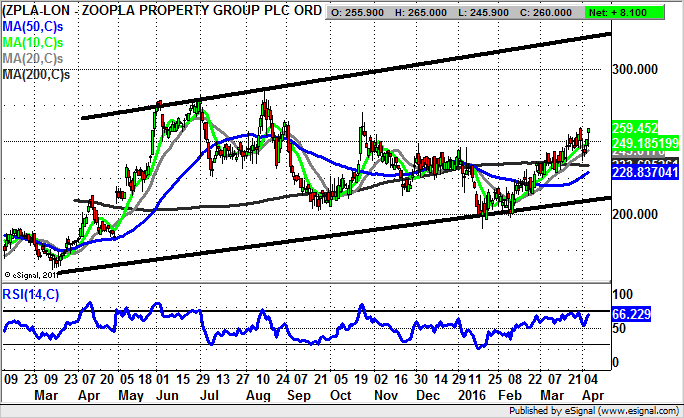
Given the way that checking to see what your home is worth is something of a national past time, it is perhaps not surprising that shares of Zoopla have been firm or very firm for most of their time on the stock market. The present configuration here is that there has been a rising trend channel in place from as long ago as this time last year. The floor of the price channel currently runs at 210p, with the more immediate support seen as being at the 200 day moving average at 233p. The assumption to make now is that provided Zoopla shares remain above their 200 day line on an end of day close basis we should be on the receiving end of further significant upside from the post March bull flag which rests above this feature. At this stage the favoured destination is seen as being as great as the 2015 resistance line projection at 325p over the next 1-2 months. Any dips towards the 10 day moving average at 249p to improve the risk/reward of going long are regarded as a buying opportunity.
Small Caps Focus
Pantheon Resources (PANR): 200p Price Channel Target
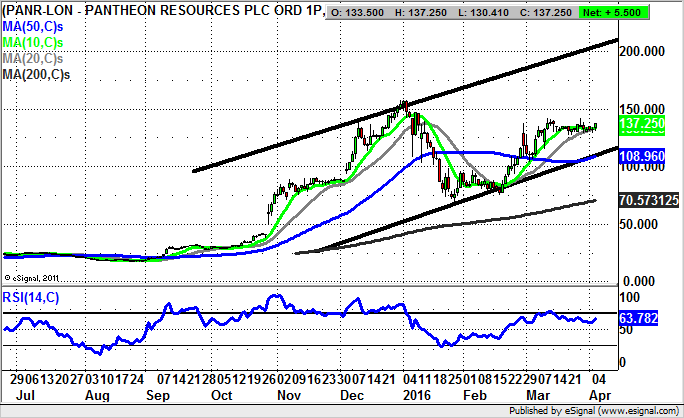
While it is the case that Pantheon Resources shares have already come up a long way in a relatively short space of time, it does look as though there could still be more on its way for the bulls. This is said in the wake of an extended bull flag, one which has been in place on the daily chart from as long ago as the beginning of March. The key point to note here is the way that it is possible to draw in a rising trend channel from as long ago as October. The support line of the channel currently runs at 110p, level with the 50 day moving average. Therefore it may be said that provided there is no end of week close back below the 2015 price channel the upside here is regarded as being as great as the 2015 resistance line projection running as high as 200p. Especially while recent support towards 125p remains unbroken the view is that there could be a push as high as the price channel top of 200p over the next 1-2 months.
Tungsten Corporation (TUNG): October Price Channel
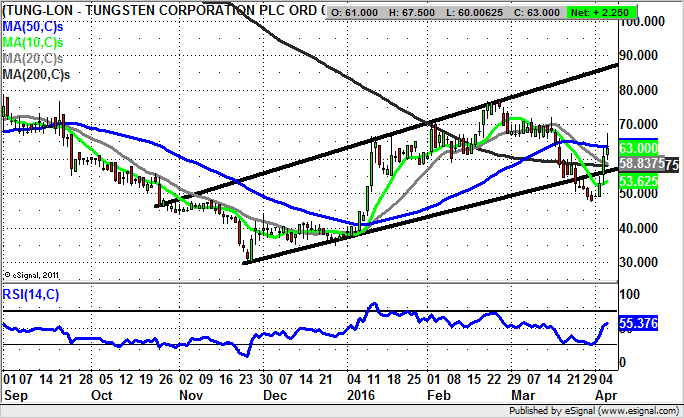
It has certainly been quite a journey with regard to the price action of Tungsten Corporation over recent months. Arguably, the latest phase here began with the break above the 50 day moving average then at 42p in early January. This logically delivered a decent rally for the stock, given the way that for stocks or markets a clearance of the 50 day line after an extended decline usually does serve up at least an intermediate rebound. As for the position now, it can be seen how the progress within a rising trend channel currently based at the 200 day moving average at 58p continues. The assumption to make is that provided there is no end of day close back below the notional double support just below 60p, we can look forward to fresh new gains. Just how high Tungsten Corporation shares could stretch is suggested by the October resistance line projection as high as 88p. The timeframe on such a move is expected to be as soon as the next 1-2 months, and perhaps sooner on any quick clearance of the 50 day moving average at 63.9p.
Comments (0)