Zak’s Daily Round-Up

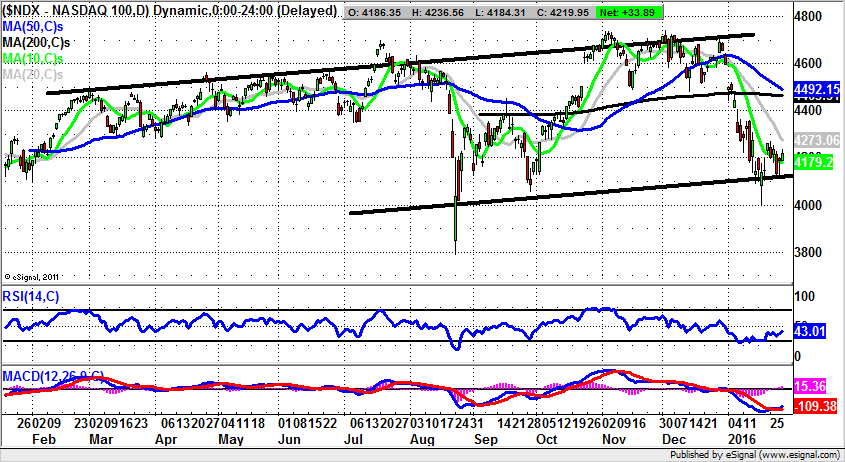
Market Direction: Above 4,100 Leads Back to 4,500 on Nasdaq 100
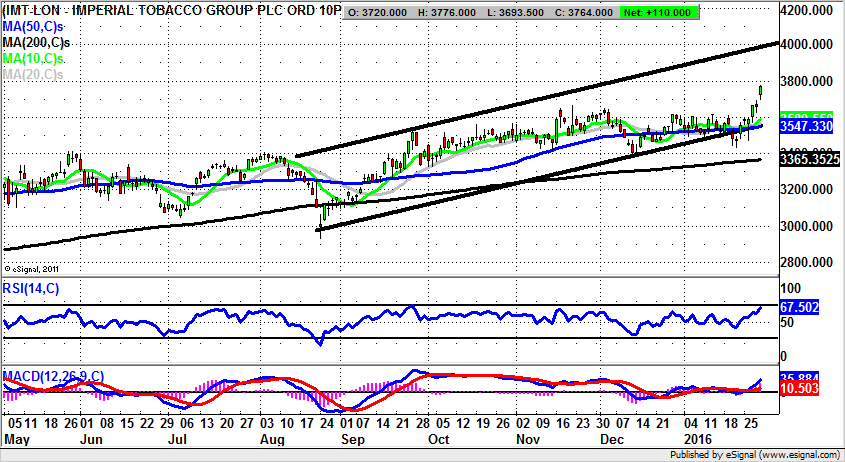
Imperial Tobacco (IMT): Price Channel Target as High as 4,000p
Although it may be the case that on a fundamental basis shares of Imperial Tobacco may appear to be a little too 20th century for some, the trend on the daily chart does look as though it is well entrenched, despite the way that the anti-smoking lobby looks to have won the day, and the future. Clearly though, there are still enough places in the world where the right to die of lung cancer is alive and well, so to speak. What we do know regarding this company is that it is in the frame as a possible takeover target. Unfortunately, this state of affairs has been in place for a decade or more. Presumably at some point in the near term the pressures on the sector will mean that there is consolidation. This idea has evidently been dominating the price action of Imperial Tobacco – a point which is backed up by the way that not only has there been a long lived rally, but that it was kicked off as long ago as February 2014 in its latest manifestation by a 50 day / 200 day moving average golden cross buy signal. Since then there has been decent progress delivered to the bulls, most of it within a rising trend channel which has dominated the situation, especially since August last year. The floor of the channel currently runs at 3,547p, level with the present level of the 50 day moving average. The implication is that, provided there is no break back below the 50 day line, the upside here over the next 1-2 months could be as great as the 2015 resistance line projection at 4,000p.
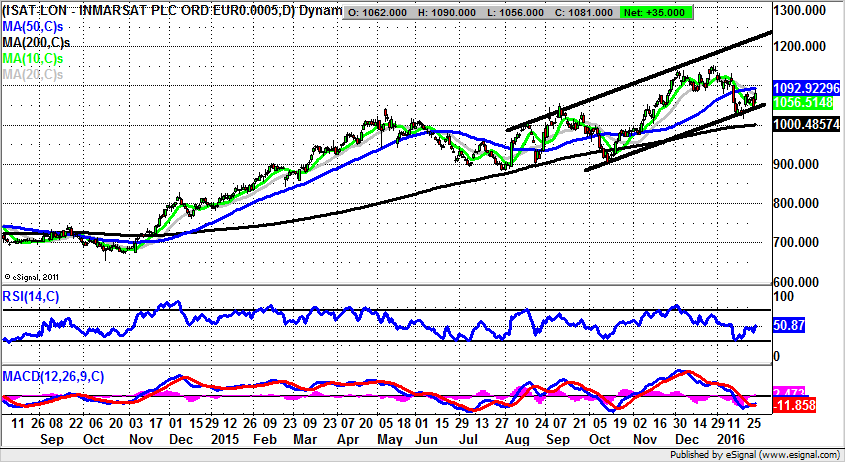
Inmarsat (ISAT): 1,200p Expected on 50 Day Line Break
Inmarsat shares have perhaps not quite skyrocketed – to go with the business model of the company – but they have performed well enough in the recent past. This is particularly the case when one compares this situation with the plight of the FTSE 100, mauled as it is by its collection of resources stocks. The view at the moment is that one would expect this stock to be able to shake off the general malaise among blue chips, as well as being among the first to take off if investors get back into a more positive frame of mind as 2016 progresses. The present position is that we are looking at progress within a rising trend channel from August which can be drawn with its support around the 1,050p level. This is just below the present position of the 10 day moving average at 1,056p. Indeed, the view at the moment is that, provided there is no end of day close back below the 10 day line, one would be looking to a 2015 price channel top at 1,200p. The timeframe on such a move is seen as being the next 1—2 months.
Bull Call
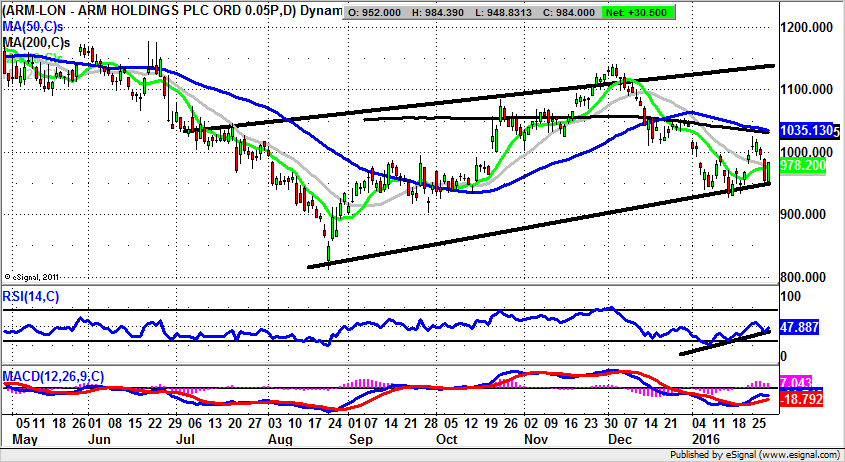
Buy ARM Holdings (ARM): 1,200p on Tap After Latest Rebound
Normally it is the case that the Bull Call here tends to be a mid cap or smaller in terms of the market cap. However, for today we are in the FTSE 100, with an old favourite from the Dot.com era. Luckily, ARM is one of the few that made it out of that era alive, and has indeed flourished as it is an Apple (AAPL) supplier. While some may be cautious from a fundamental perspective regarding ARM’s future prospects given the way that the iPhone maker appears to be slowing down, from the daily chart perspective of the UK company the hope at the moment is that we are looking at a dip to buy into. This is because the stock is hanging towards the floor of a rising trend channel which has been in place since July. The fact that there have been three support points over the past month is helpful, with the idea being that, provided there is no end of day close back below the latest 948p swing low, the anticipated upside is regarded as being as high as the 2015 resistance line projection currently pointing at 1,140p. At this stage the timeframe on such a move is regarded as being the next 4-6 weeks. Only cautious traders would wait on a clearance of RSI 50 versus 49 at the moment, as their momentum buy signal before going long.
Bear Call
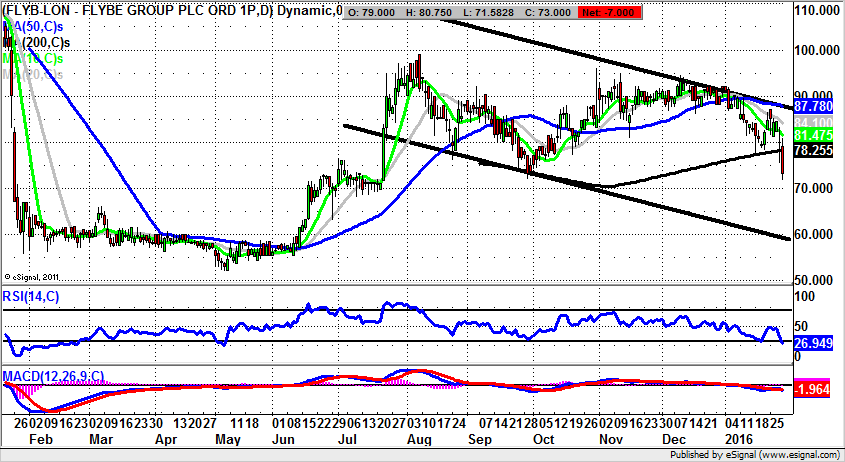
Sell Flybe (FLYB): Risk of 50p While Below 200 Day Line
One of the big breakthroughs for airlines stocks over the past decade and more is the way that they have improved on the old flag carrier / money losing approach of the likes of British Airways before it became International Consolidated Airlines (IAG). Ironically, it would appear that the influence of the “no frills” approach has served to act as a booster for many players in this area, both great and small. But it has not been a story of untainted happiness. What can be seen on the daily chart of Flybe is the way that we have just suffered quite a sharp break to the downside through the 200 day moving average now at 78p. The rather simple message at this stage is that below the 200 day line one would be fearful of further significant downside for Flybe. Indeed, the loss of the 200 day line officially suggests that the shares are in bull mode, after a quite brave recovery from the beginning of last year. With the price action currently governed by a falling trend channel which can be drawn from as long ago as October 2014, it would appear that for this stock we have a situation where the bulls are progressively losing control. The risk currently is that, provided there is no weekly close back above the 200 day line, we could see a journey towards the 2014 price channel floor. This has its support line projection pointing as low as 50p, a target which could be reached over the next 1-2 months, especially if the 200 day line caps the price action over the next week in a consistent way.
Comments (0)