Zak’s Daily Round-Up

Market Position: Gold Above $1075 Targets $1150
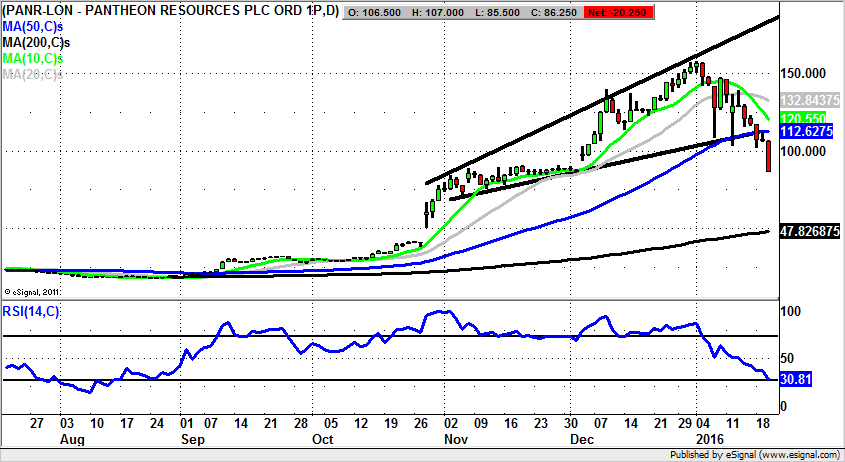
Pantheon Resources (PANR): Risk of Further Correction
Pantheon Resources was certainly the exception that proved the rule as far as oil & gas stocks being in the doghouse off the back of the plunging Crude Oil price. The big pitch for bulls of this company was and is the alleged single-figure production cost, along with the quantity of the black stuff underground. However, the pitch does not appear to be quite as robust now at the start of 2016, as for all we know by the end of this year we shall indeed see Crude Oil In single figures. That is not to say that Pantheon Resources is for its sector the best thing since sliced bread, but it might explain the latest pullback for the share price. The best description of what is going on currently is that we have seen a gap fill of the December feature with its floor down to 88p. The ideal scenario is that we will see some buying interest in this region. However, even if you are ultra keen on the shares you would wish to see at least an end of day close back above 88p as a momentum buy trigger. Otherwise, there is the risk of a deeper dive as low as November lows in the mid 60s. Hopefully for fans of this stock it will not come to that, but in current stock market conditions where babies (decent stocks) are very often thrown out with the bathwater (overpriced rubbish), one cannot always guarantee quality plays do not suffer at the hands of the bears.
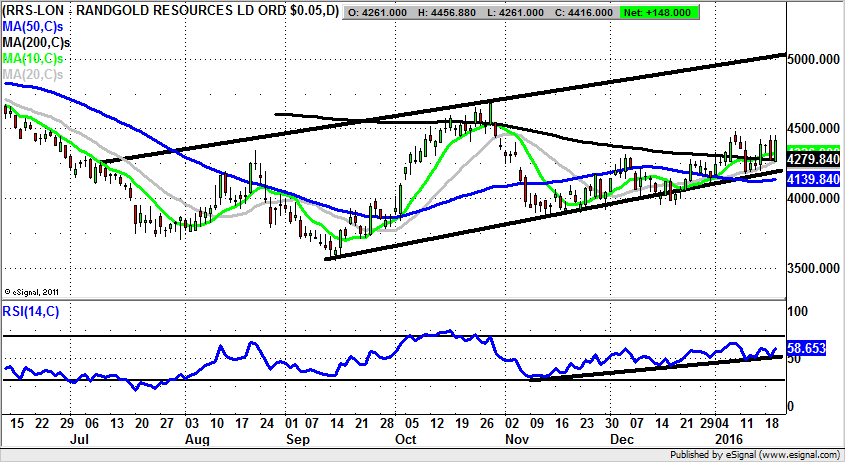
Randgold Resources (RRS): A Defensive Mining Stock
Given the pain and suffering which has been evident across almost all of the mining sector in recent years, looking at the daily chart of Randgold Resources appears to be one of the most pleasurable things one can do. At least we do not see the persistent downtrends which dominate the daily chart of companies both great and small. Indeed, when you compare Randgold Resources with the likes of Anglo American (AAL), or of course the ailing Glencore (GLEN), we are really into a very defensive prospect. This point was underlined to me by a member of the audience at a recent investor evening, when it was suggested to me that the company had avoided many of the pitfalls of its peers by not over expanding, not issuing paper like confetti, and not shuffling the pack of management on an incessant basis. In many ways, even though this company is in the FTSE 100, it behaves as if it were a well run growth company in the small cap area. As far as the technical position on the daily chart it can be seen how we have been treated to an improving picture since the September bear trap rebound from below the former July 3,700p support. The vehicle for recovery has been a rising trend channel which it is possible to draw from as long ago as July. The floor of the channel currently runs level with the 50 day moving average at 4,139p and is backed by an extended RSI uptrend line from November. All of this should mean that provided there is no end of day close back below the 50 day moving average we could witness a best case scenario target as high as 5,000p at the 2015 resistance line projection. The timeframe on such a move is seen as being the next 1-2 months at most.
Bull Call:
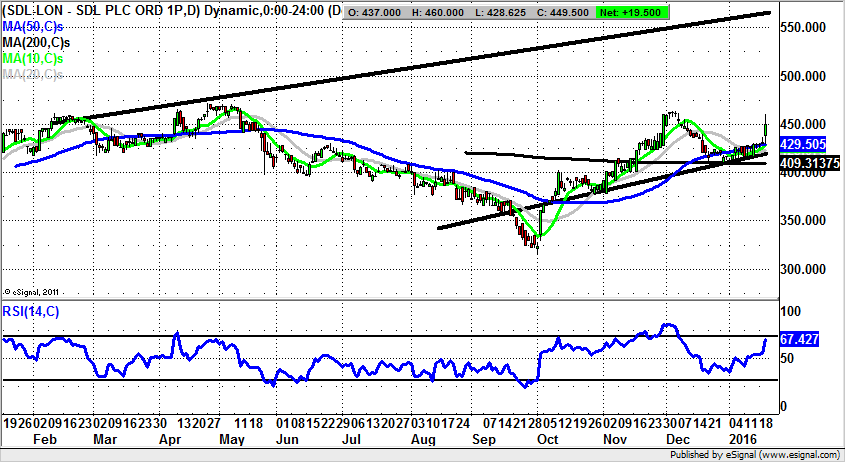
SDL (SDL): Outperformer in a Stock Market Plunge
It can be said quite fairly that being in a bear market is not necessarily all bad for the traditional long only investor. Whereas it can be difficult to discern between the wheat and the chaff when the good times are rolling, that’s not the case on a day when the FTSE 100 is plummeting in triple digits. Of course, sometimes the apparent strength is short covering in bombed out situatios which is unlikely to last. But in the case of SDL it can be seen how the recent rebound has been a robust one, starting from a V shaped reversal at the beginning of October. Since then we have seen progress within a rising trend channel, one which can be drawn in from as long ago as February. What has been particularly helpful as far as the price action is concerned over recent weeks is the way that support for the stock has tended to come in at and above the 200 day moving average now at 409p. The implication is that the turn for the stock from technical bearishness to bullishness has essentially been in place since the 200 day line was recovered on a sustained basis in early November. What is particularly helpful as a continuation buy signal is the way that the shares have closed above a rising 50 day moving average at 429p. This leads us to suspect that provided there is no end of day close back below the 50 day line we should be on the right side of a surge towards the top of the rising 2015 price channel with its resistance line pointinng as high as 560p. The timeframe on such a move is regarded as being as soon as the next 4-6 weeks.
Bear Call:
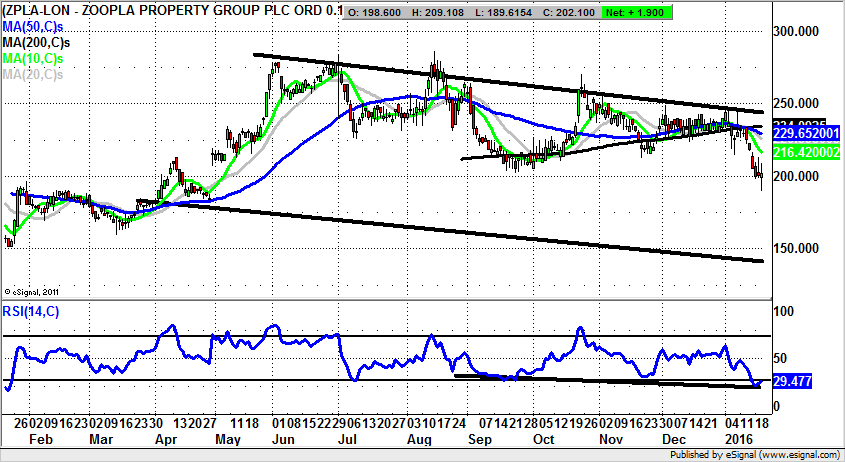
Zoopla (ZPLA): Threatening Gap to the Downside
It should be the case that online estate agent Zoopla is a great play on the UK housing market. This would of course mean that one was long and strong as far as the shares in this company are concerned, but alas, fundamental analysis and timing do not always go together. That said, even with the greatest technical skills in the world one always prefers the backing of a decent story, and presumably at least for now with UK house prices rising some 6% a year, and the promise of low interest rates for longer, the backdrop here at Zoopla overall has to be regarded as robust – especially as compared to the state of many larger companies with international exposure in the FTSE 100. Looking at the detail here on the daily chart we can see how there has just been a gap to the downside for early January. While of course this may not be significant in isolation as a sell signal, the bears will be looking to see if there is backing for the idea of at least an intermediate breakdown. In particular we would be looking to a weekly close back below the former September intraday support at 202p. If this was delivered over the next week or two one would fear that there could be a decline towards the floor of a falling trend channel drawn from March at 140p. But it should be stressed at this stage that one would really wish to see September support give way before getting carried away with the shorting idea.
Comments (0)