Zak’s Daily Round-Up

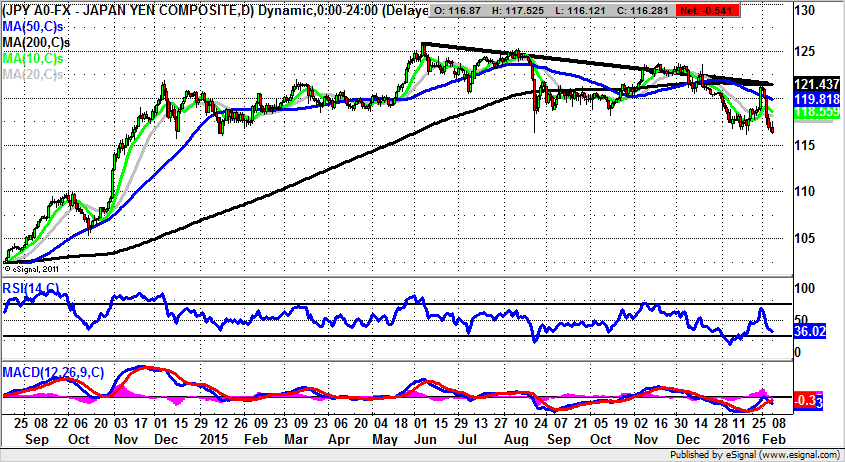
Market Position: Dollar / Yen 105 While Below 115.50
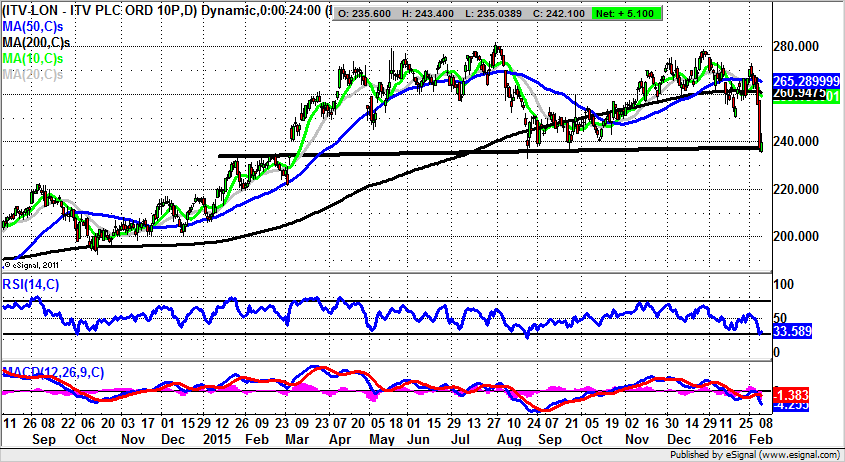
ITV (ITV): The End of the Downton Abbey Effect
One of the themes of the recent past as far as UK stocks are concerned is the idea that one should go for domestic focused entities, well away from the increasingly toxic financial area or, of course, emerging markets. This would in theory make the likes of broadcaster ITV all the rage at the moment, given that it should be relatively well insulated from the worst of what the global debt fears can throw at leading stocks. However, it does appear that some of the concerns doing the rounds among investors have penetrated the blue chip veneer of this company, especially with relation to a slowdown in advertising revenue. This may be a temporary affair, but as can be seen from the daily chart, all of this caution has taken the stock back to a key support area. This is around 235p, which is effectively neckline support over much of the past year, and former initial 2015 resistance. All of this suggests that even if you are becoming increasingly bearish on the fundamentals of ITV, it may be worth waiting on an official momentum signal. Such a trigger would be offered on any weekly close back below 235p. In the meantime, it may be argued that the best way of interpreting the latest action on the daily chart of this FTSE 100 stock is to suggest we are looking at a dip to buy into. At least while above 235p the upside is regarded as being back to the area of the 200 day moving average at 260p on a 1-2 months timeframe.
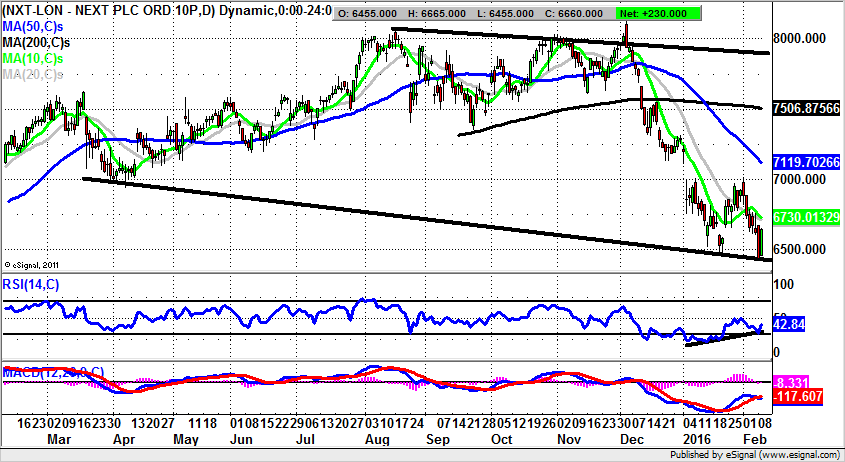
Next (NXT): The End of the Pullback?
It would appear that a couple of weeks back I finally found the answer to the question, “Who ever buys anything from Next?” The answer turned out to be occasional consumer Zak Mir, as he was forced to buy a Black Tie outfit for the Quoted Companies Awards a couple of weeks ago. The somewhat embarrassing explanation for this non-discretionary purchase was an unfortunate weight gain since the summer purchase of exactly the same outfit from Moss Bros in the summer. Perhaps as something of a coincidence, it can be seen on the daily chart of Next that the shares began their topping out process in the summer of 2015 through 8,000p and fell rather dramatically ahead of the all important Christmas shopping season. Clearly a combination of very mild weather and low expectations for retail sales caused the bears to be out in force. Of course, there was also the issue of a tumbling stock market, which has been so severe that even the wheat has been sold off with the chaff. Nevertheless, one would suspect that domestic focused companies with decent visibility of earnings and good management – well away from financials and emerging markets – will be favoured in the long run by bargain hunters. This musing puts Next in the frame for recovery, helped along by the latest price action. We can see how there has been a bear trap rebound for February from just below the January 6,460p floor. Indeed, the overshoot was just 5p before the stock bounced – the type of bounce which can lead to a sharp squeeze. Such a move is expected to allow the shares to retest the main 2016 resistance zone at 7,000p, just below the 50 day moving average at 7,119p – on a 2-4 weeks timeframe.
Small Caps Focus
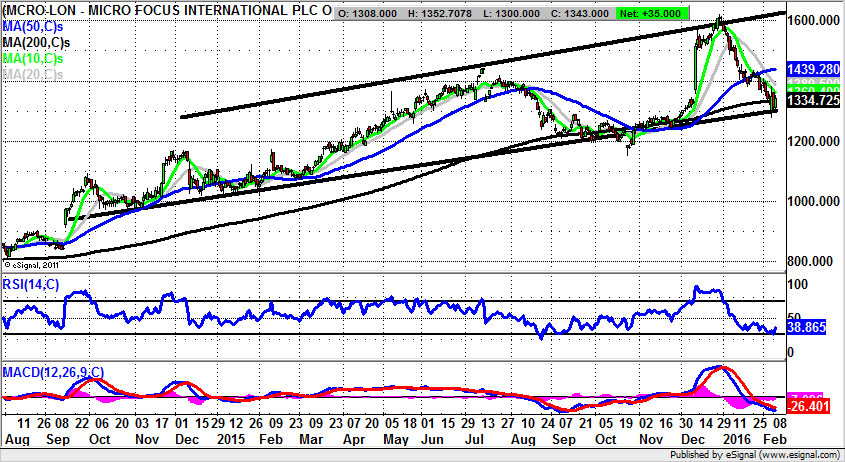
Microfocus International (MCRO): Accelerating Uptrend
It may be argued that the big event for the daily chart of Microfocus International was the massive unfilled gap to the upside through the 50 day moving average, then in the 850p zone in September 2014. Since then we have been treated to a decent progression within a rising trend channel which can be drawn in from as long ago as the autumn of 2014. The points to note since then are the relatively consistent progress the stock has made to the upside, as well as the extended September to December bear trap rebound from below the 200 day moving average now at 1,334p. The break back above the 200 day line which is being attempted to start February is certainly encouraging, especially as this is a rising feature. However, it is probably the case that the best buy trigger currently would be an end of day close above the 10 day moving average now at 1,359p. As little as such a signal should be enough to unleash a one month target at the 50 day moving average at 1,439p, with the top of the range at 1,600p plus in focus up to two months afterwards.
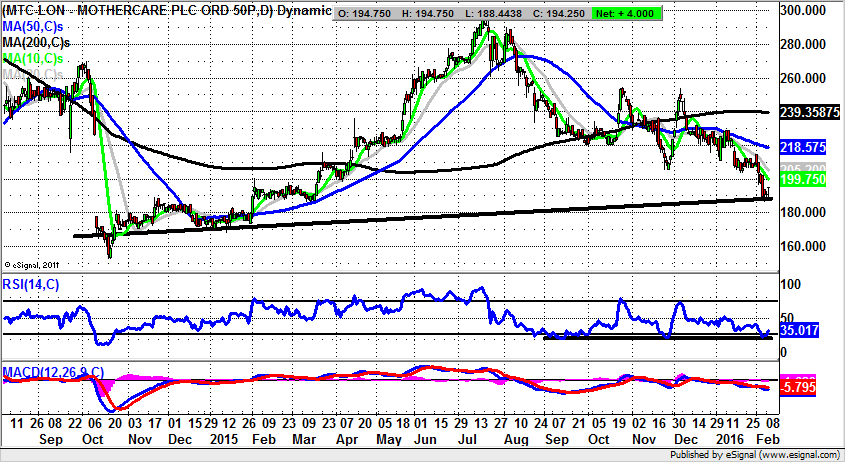
Mothercare (MTC): Extended Support Line
We have a common theme for today’s small caps in the sense that from a charting perspective we are back to basics, using the most simple of technical indicators – the trendline. In the case of Mothercare this simple approach may be the right way to go considering the fundamentals here have been extremely difficult – the general vagaries of the retail sector notwithstanding. As far as the technical call here is concerned, the hope is that the stock has bounced off the main trendline in place from as long ago as October 2014. This runs at 186p, giving us a decent risk / reward trade. The idea is backed by the way that there has been a rebound off a support line in the RSI window. This runs just under 30, and could provide enough momentum to take Mothercare shares back up to the main resistance feature on the daily chart – the 50 day moving average. The implication is that we can look forward to a target up towards 218p, the present position of the 50 day line. The timeframe on such a move is regarded as being the next 4-6 weeks. At this stage only cautious traders should wait on a break back above the 10 day moving average at 199p as their momentum buy trigger before thinking of going long.
Comments (0)