Turning Points in Commodities (Part 2)
")
Yesterday I wrote about commodities that are at key support levels. In this post I’ll look at some that the arse has fallen out of. But we could be about to see a change in all that…
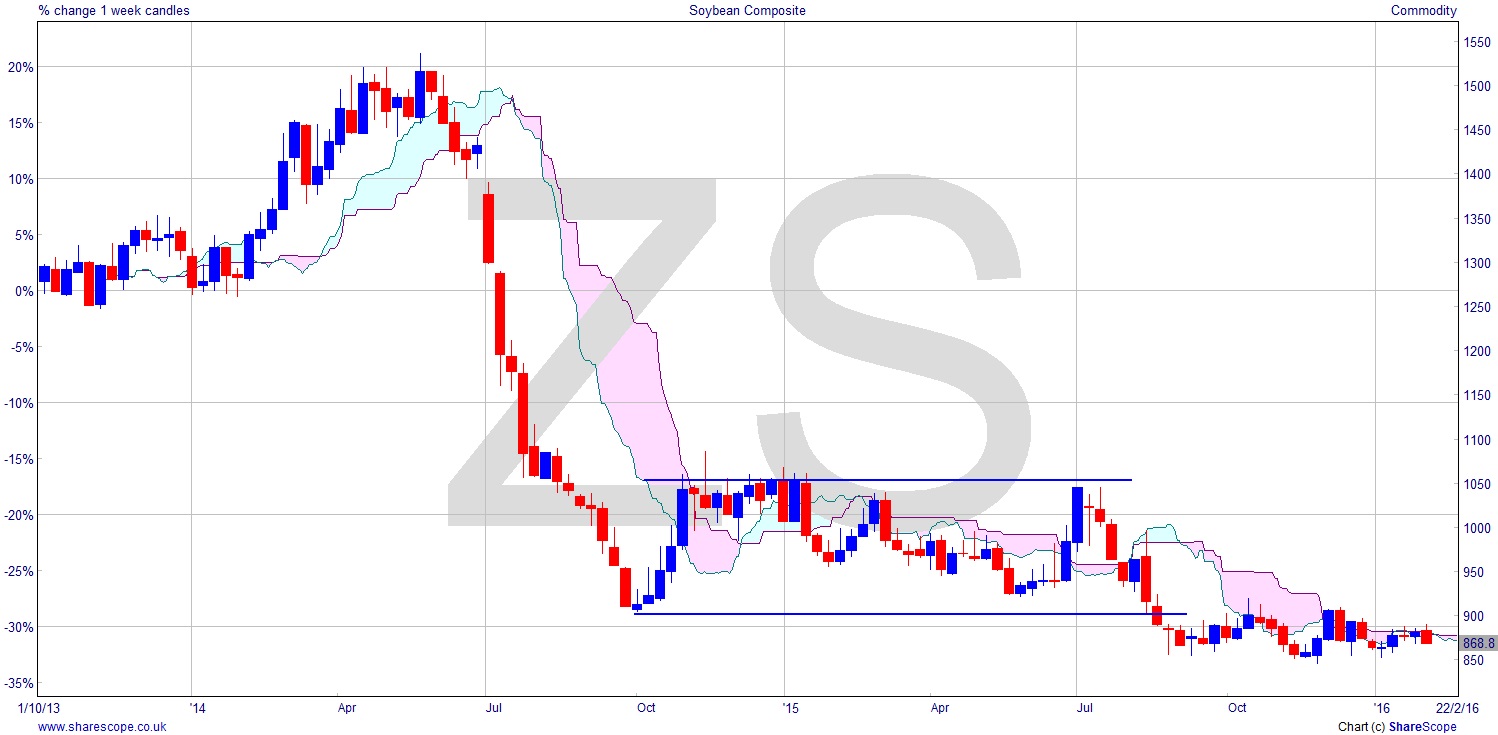
Soybeans [ZS] is pretty dismal. We could suggest a measured move here. The only snag is that it’s fallen into another congestion area just below the main one. With TA it’s preferable if we get clear signals, not mixed ones. This is very mixed. It’s still looking bearish and if you’d gone short in July when it made a new (slightly) lower high, then you’d be in profit but wasting time, another thing we don’t want to do. Capital should be working and in this scenario it’s in a sun lounger at your expense.
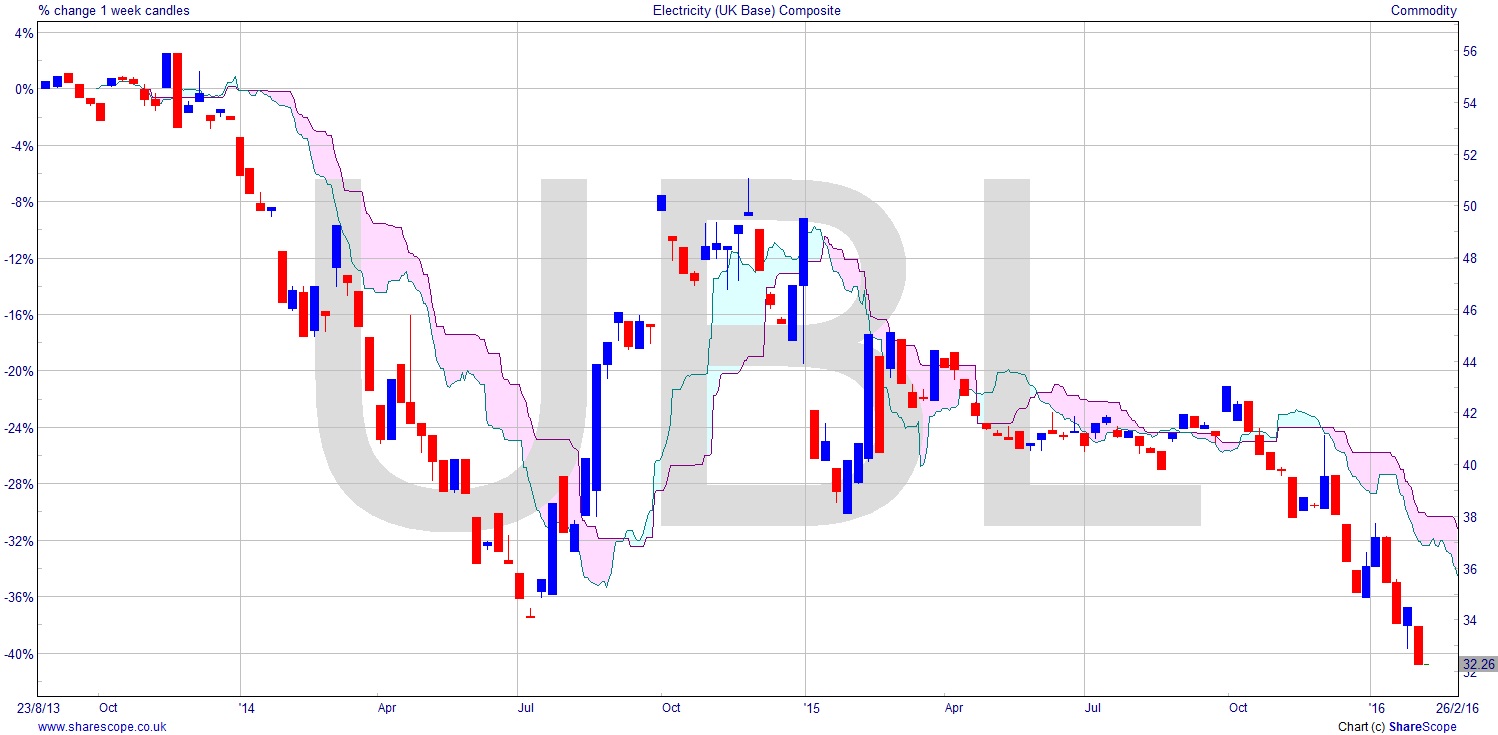
An interesting one is Electricity (UK Base) Composite [UBL]. I guess our electricity bills should be following our gas bills down, if this is anything to go by. At a chart low – although to be fair, this is not that long a price history, having only started in 2013. So, whilst it may not be representative enough to make some of the tempting sweeping judgements, it’s still very bearish.
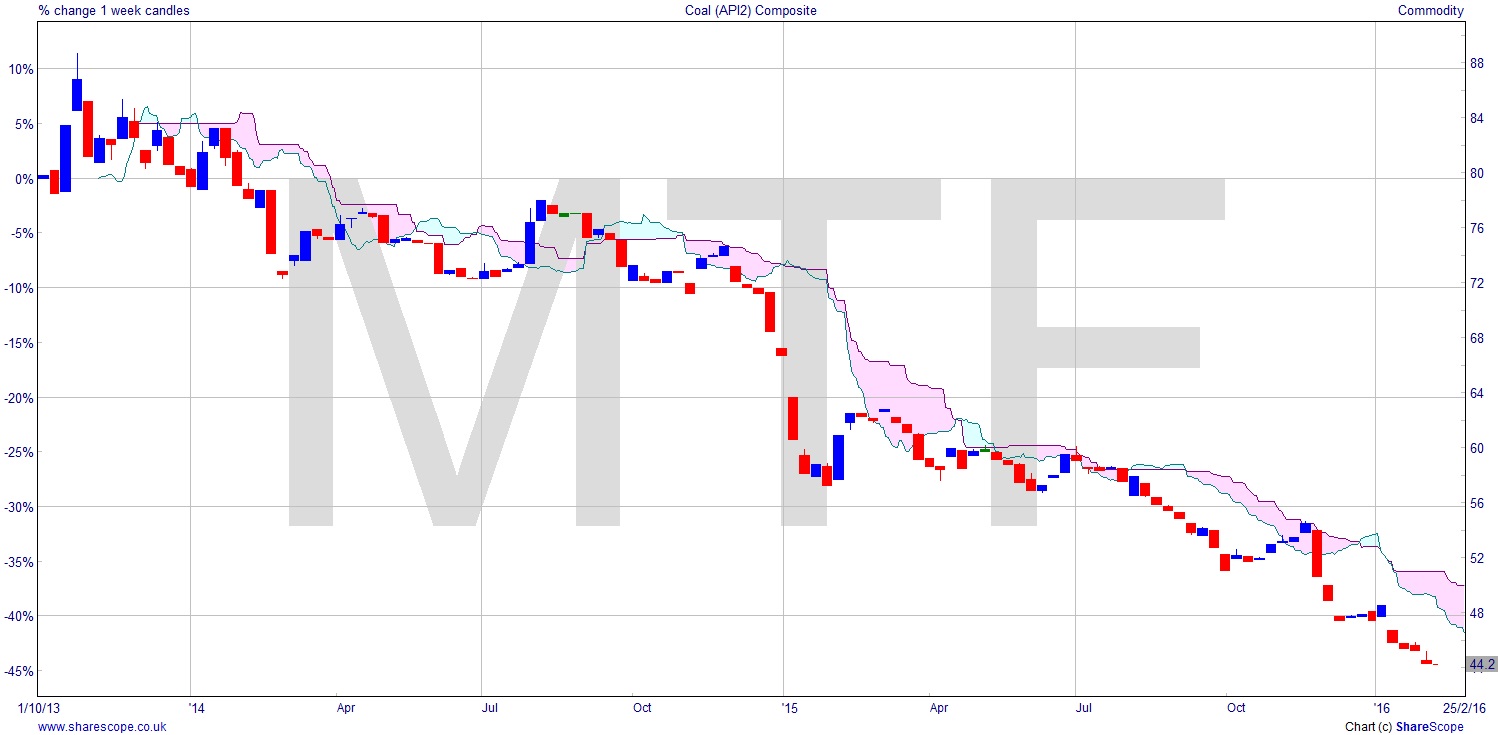
Coal (API2) Composite [MTF] is another fairly new chart. Back to 2013 it’s basically been falling. This year is the anniversary of the Miners’ Strike. In fact, every year is the anniversary of everything that’s ever happened. Very little jumps out from this chart except that if you’ve already been short for some time you deserve a pat on the back.
There is a good case for looking at electricity companies. Are they making profits they’re not passing on? Or are they seeing their business model damaged by having to reduce prices whilst fixed costs stay the same, and exceptional items rise if they’ve been hit by flooding in the north?
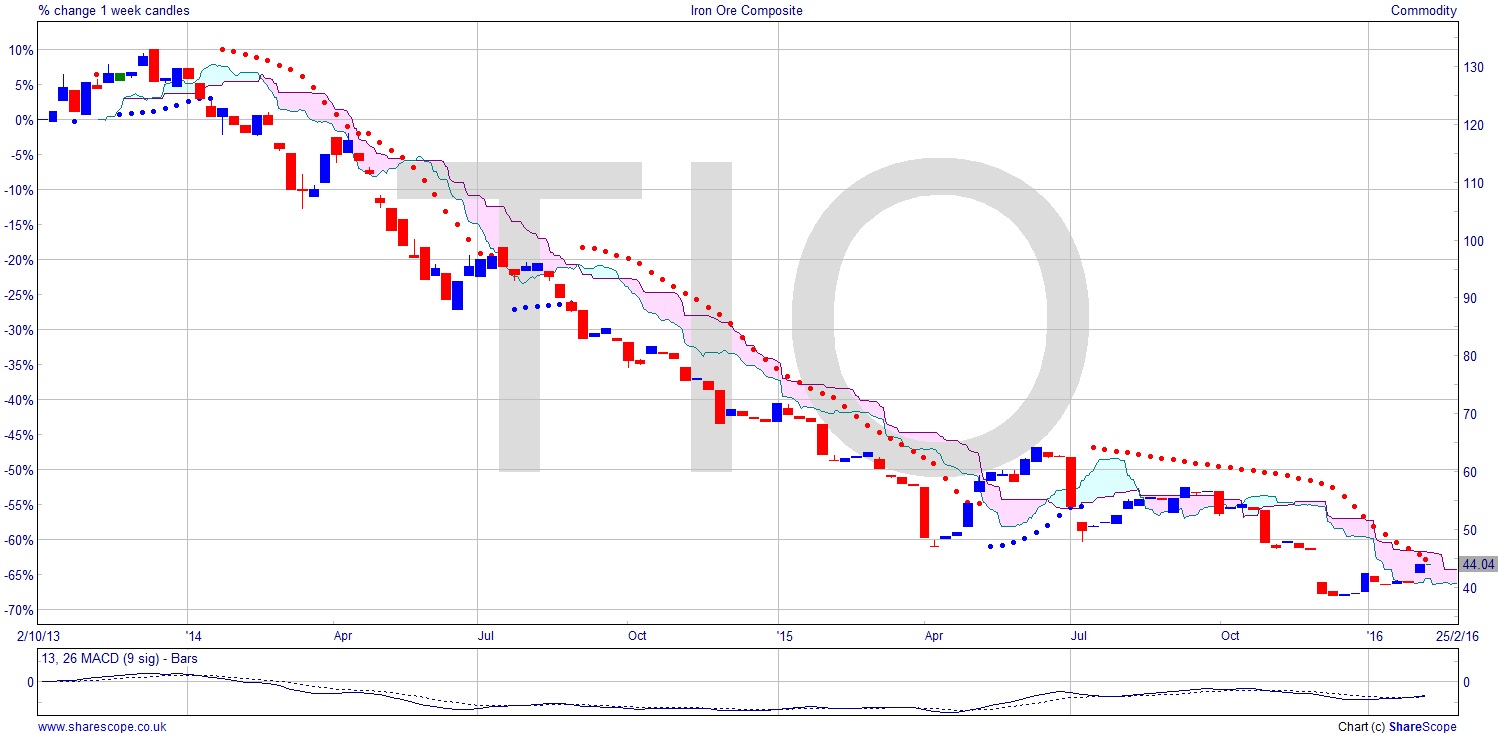
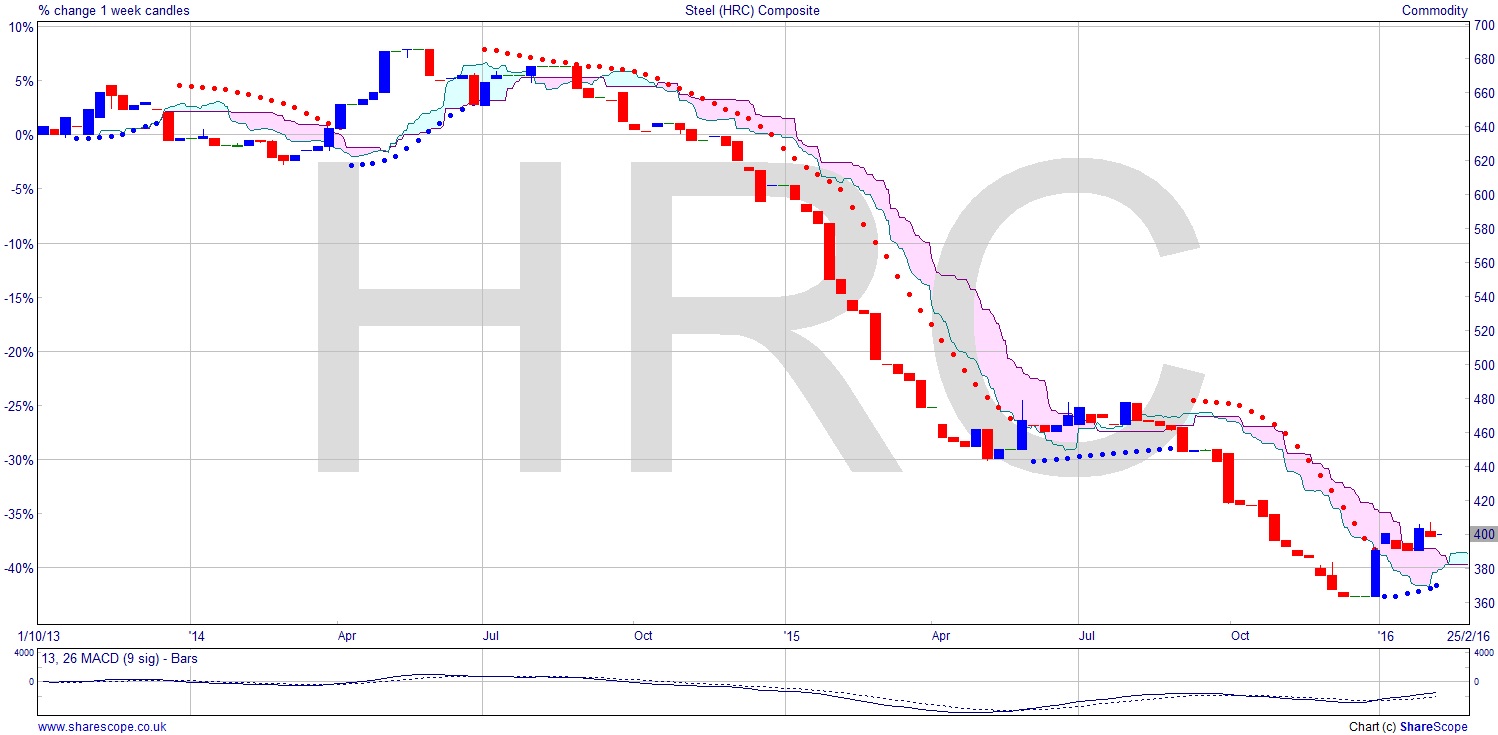
Iron Ore [TIO] is a commodity I’ve certainly never looked at before. What can you say about this chart that isn’t glaringly obvious? Well, perhaps that the MACD supports a reversal of fortune. And that the Parabolic SAR is about to be changing, too. This isn’t necessarily a reversal in the traditional sense, but just now it’s poised for a possible rise. That would take it above the cloud and turn over two years of falls into a possible long trade. Beware of false starts though like the last two occasions (where the red dots turn blue). This is supported in turn by the Steel (HRC) Composite [HRC] chart. This one has already risen above the cloud, and is a nice example of the Parabolic SAR working. A higher low and that could be considered an entry signal. If it does take a leg up, a likely stopping point would be a 50% retracement, which gives a target of 520 (the current level being 400). Could steel lead the commodities out of ‘recession’?
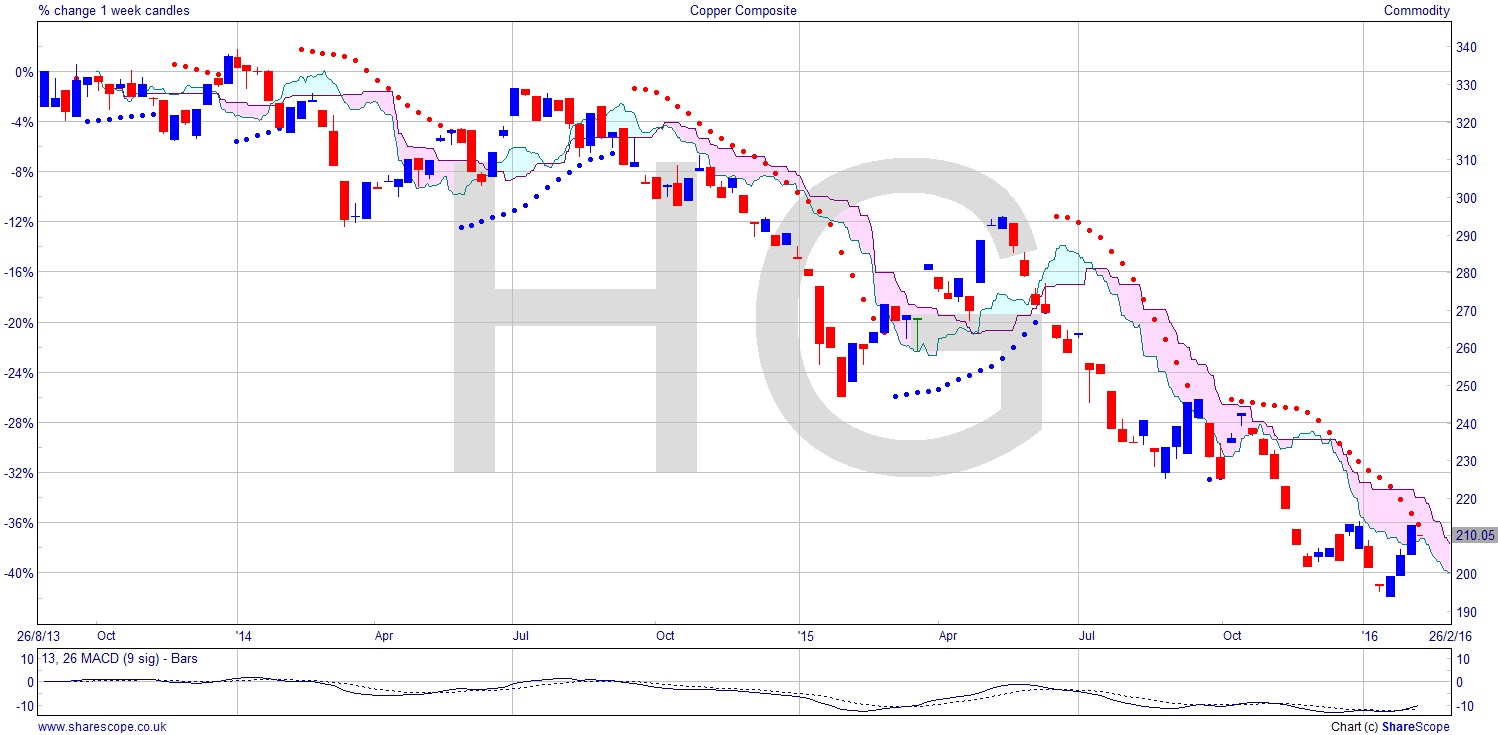
Maybe the inclement weather and a smattering of earthquakes have stimulated demand for steel to rebuild infrastructure. Not so much economic, but meteorological growth! If that’s the case then we can expect Copper [HG] to follow suit. And the chart says it’s not far behind. A relatively strong move up into the cloud, and a continuation of that will see it become bullish after falling for some years. MACD supports a rally and Parabolic SAR looking hopeful too.
Steel, copper, iron ore… all look rather interesting. That means iron ore, steel and copper producing companies and countries should be not far behind. I’ll look at those in my next post.
Comments (0)