Zak’s Daily Round-Up: FRES, GLEN, RDSB, CNRD and HNR

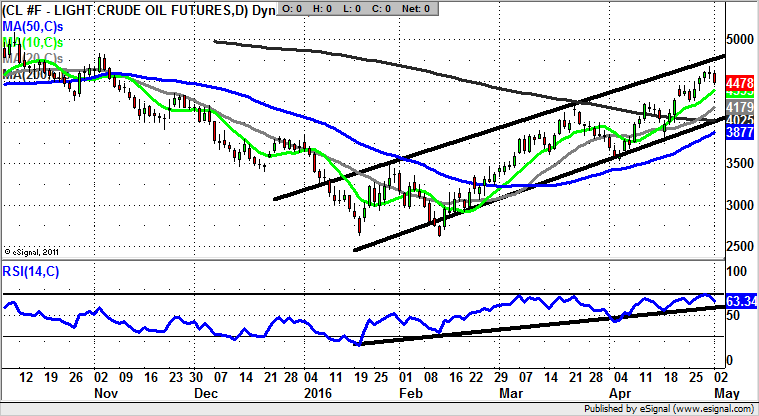
Market Direction: WTI Crude above $42 Points to $48
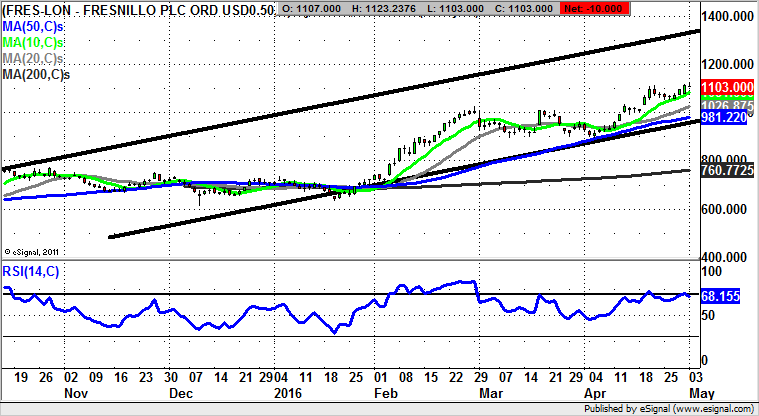
Fresnillo (FRES): 1,320p 2015 Price Channel Target
To use the old futures markets term, it can very well be said that the FTSE 100 contingent of the mining sector has been and remains in “limit up” mode. This is certainly seen on the daily chart of Fresnillo, where there has been progress within a rising trend channel which can be drawn in from as long ago as September. However, the real starting gun on the big rally of the past few months was the unfilled gap to the upside, above both the 50 day and 200 day moving averages. April finished with another as yet unfilled gap to the upside which preceded the latest U shaped consolidation pattern – one of the strongest in the book. The chances now are that at least while there is no end of day close back below the 20 day moving average at 1,072p, one would be looking to quite a direct move to the top of last year’s trend channel at 1,320p. This could be achieved as soon as the end of this month. In the meantime any dips towards the 10 day line can be regarded as buying opportunity. At this stage only back below the 20 day moving average at 1,017p is regarded as even beginning to delay the upside argument.
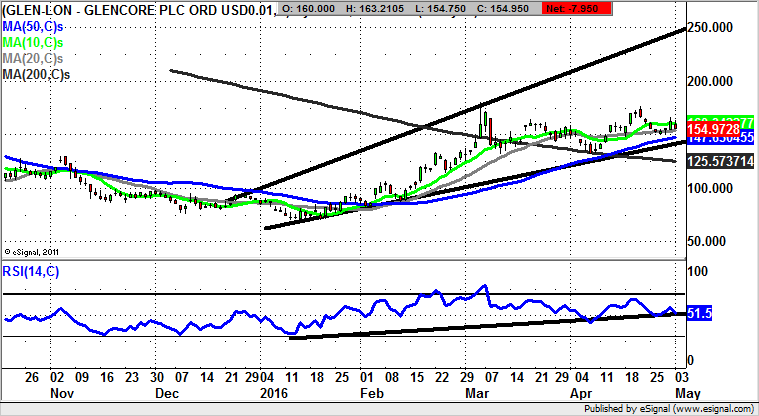
Glencore (GLEN): 250p 2015 Resistance Line Destination
Given the way that at one point at the turn of the year there were some siren voices questioning whether the mining giant could survive, the recovery since then has been remarkable. That said, the fact that there were such question marks over this company has actually made the rebound all the more powerful. What can be seen currently on the daily chart is the way that we continue to be treated to the aftermath of an extended clearance of the 200 day moving average, now at 126p. But the big plus point here is the way there has not been any need to date for a retest of the 50 day moving average currently at 146p. The assumption to make now is that provided there is no end of day close back below the 50 day line we could and should be treated to significant further upside. Just how high this may fly is suggested by a line of resistance which can be drawn in from as long ago as the end of December. This line is pointing at 250p, an area which may appear to be a long way away. But given the way that the post March consolidation here is most likely a mid move consolidation on a rebound which started from well below 100, a 250p target over the next 4-6 weeks may not be so far-fetched after all.
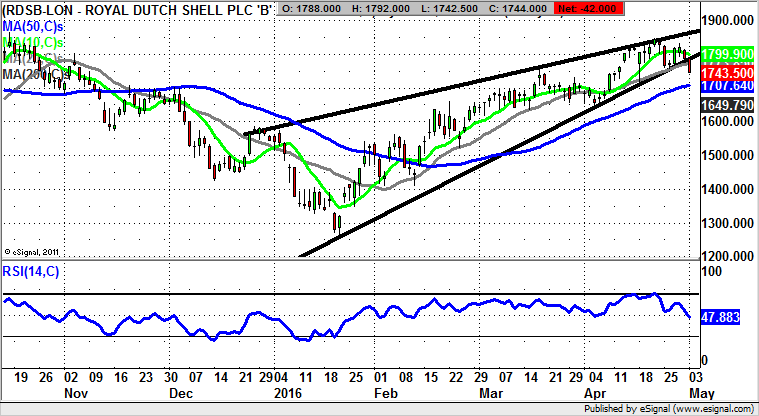
Royal Dutch Shell (RDSB): Bearish Rising Wedge
What may or may not be the analogy to make in terms of the recovery since the start of the year at Royal Dutch Shell is the way that the price pattern here is rather similar to that evident on the Dow and S&P in the U.S. This may not be a coincidence considering how much the stock market seems to be soothed by any rise in Crude Oil prices. At the same time the pattern over the past five months on the daily chart of Royal Dutch Shell resembles a bearish rising wedge pattern, which is something that could over the course of May undermine much of the rally we have seen. Indeed, the implication is that as little as a weekly close by shares of Royal Dutch Shell back below the January support line at 1,771p / 20 day moving average could lead the stock back down to the old February support under 1,550p. However, it has to be admitted that fans of Royal Dutch Shell may wish to wait on a break below the 50 day moving average at 1,704p before assuming that there is a high risk of an extended bear phase here.
Small Caps
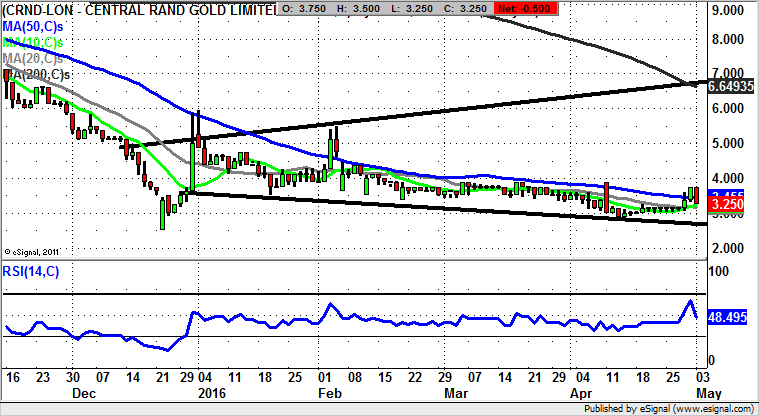
Central Rand Gold (CNRD): Triangle Target at 7p
It looks as though we have signs of recovery here at Central Rand Gold. This is perhaps something not entirely surprising given the way that the shares have spent an extended period building a base, and perhaps just as importantly, considering how much Gold and precious metals have rallied so far this year. All of this goes to suggest that provided we get a decent weekly close back above the recent 3.75p resistance for the beginning of May, either this week or next week, we can look to a decent recovery. The favoured destination at this point is as high as the top of a broadening December triangle, with its resistance line projection heading to the 7p zone, just above the 200 day moving average at 6.5p. The time frame on such a move is expected to be as soon as the end of this month.
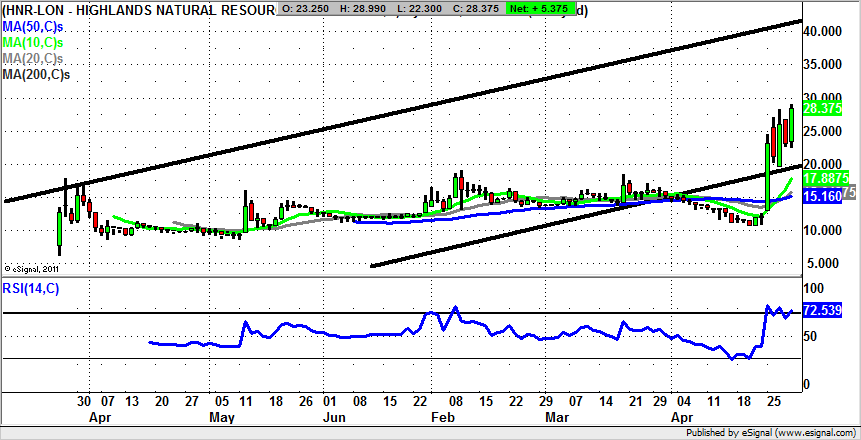
Highland Natural Resources (HNR): Target as High as 60p
Although it can very often be a mistake to keep on upgrading the technical target on a bullish situation, in the case of Highland Natural Resources we may be justified. This is because the stock is fast approaching our original 40p destination. Of course, most traders who went long around the 20p mark may be happy with this. However, there is just the chance given how solid the charting structure looks here that an end of day close back over 40p could be enough to hit a new red resistance line projection from April last year over the 4-6 weeks following any 40p clearance. At this stage only sustained price action back below 30p really delays the upside scenario.
Comments (0)