Zak’s Daily Round-Up: BP., CNA, NG., FOG and IOG

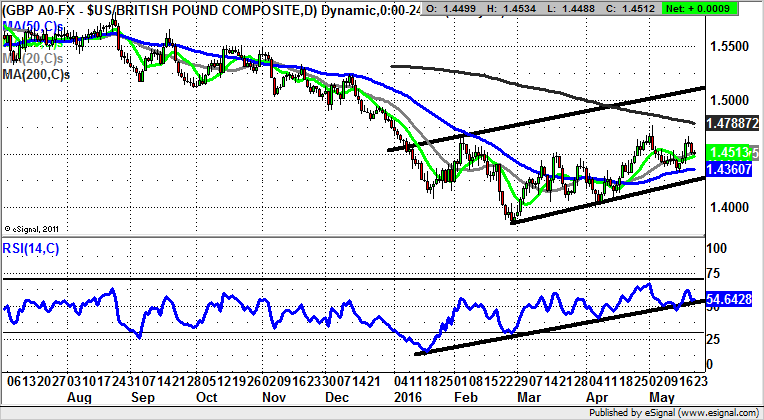
Market Direction: Cable above 50 Day Line Targets May Peak
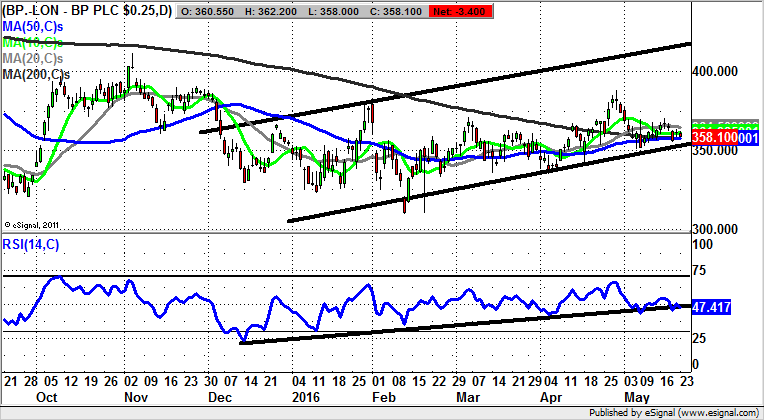
BP (BP.): Above 370p Targets 420p
Considering how volatile the stock market has been in recent weeks, as well as the price of Crude Oil, it is interesting how the share price of BP remains a relatively flat affair. This can be seen on the daily chart of the oil giant over recent months, where there has been slow progress within a rising trend channel which can be drawn in from as long ago as the beginning of December. The floor of the channel runs just below the present level of the 50 and 200 day moving averages at 357p. The assumption to make is that at least while there is no end of day close back below the initial May support at 351p – sub 340p to be safe –we are waiting on decent upside. This is particularly the case while there is no break of the multi tested December uptrend line in the RSI window, off which the stock has just bounced again near the neutral 50 level. In terms of what the upside could be, we are anticipating a 2015 resistance line projection target as high as 420p. This could be witnessed as soon as the end of July, with only cautious traders waiting on a clearance of the May 370p intraday resistance before taking the plunge on the upside.
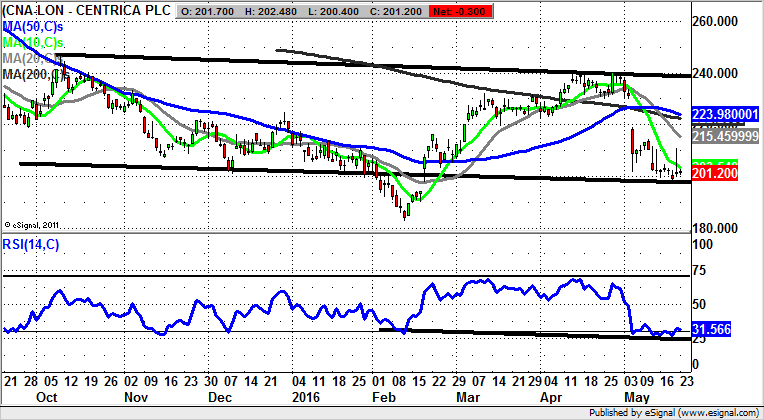
Centrica (CNA): Initial Gap Support at 194p
In terms of the degree of difficulty in charting Centrica shares at the moment, it may be said that we are looking at a situation where some might decide it is easiest to simply walk away. However, we do have one or two decent technical cues to follow. The main one is perhaps the way that this month began with a rather horrific unfilled gap to the downside through the 50 day and 200 day moving averages, so far the decline has been limited by the floor of the February gap to the upside at 194p. The message currently is that provided there is no end of day close back below the February gap, one can look to at least an intermediate rebound back towards the 20 day moving average at 217p. However, it should be noted that in the event of any end of day close back below the February gap floor one would expect to see an acceleration to the downside, fuelled by the way all the near term moving averages are falling. This is especially the case after the shooting star candle seen at the end of last week.
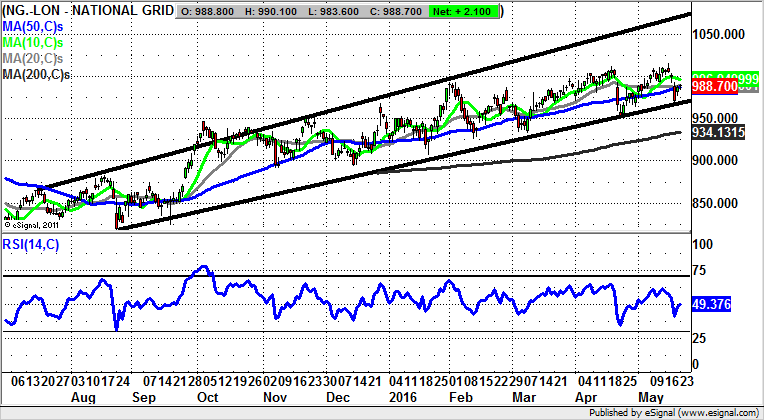
National Grid (NG.): Extended Rising Trend Channel
While it has been the case that in the recent past the traditional flight to safety in terms of utilities stocks has not exactly followed the usual pattern, it is evident that following the summer selloff the stock did outperform, at least as far as not serving up lower lows versus 2015 this year. The big positive signal to change the stock from a breakdown situation to a recovery one came with the as yet unfilled gap to the upside through the 200 day moving average, then towards 880p and now at 933p. This was followed quickly by a golden cross buy signal between the 50 day and 200 day moving averages, and since then we have seen the shares put in multiple support points above the 200 day line. Indeed, most of the best near term buying opportunities have been on the temporary dips below the 50 day moving average at the present share price level. As far as what may happen next, one would suggest that provided there is no end of day close back below the 200 day line, the upside here could be as great as the 2015 resistance line projection as high as 1,070p. The time frame on such a move is as soon as the next 6-8 weeks.
Small Caps
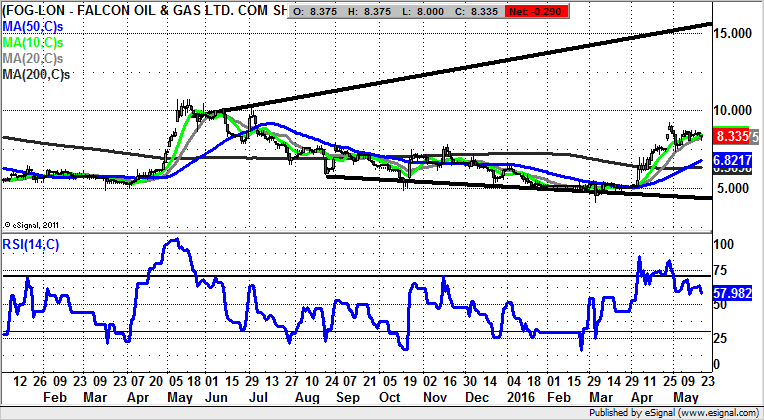
Falcon Oil & Gas (FOG): Broadening Triangle Targets 15p
Although shares of Falcon Oil & Gas are not exactly the most dynamic in town, it can be seen that after an extended base in place since as long ago as August, for April and May there has been quite a rebound. The present position can best be described as a likely mid move consolidation after last month’s gap to the upside. If you add in the way the past week has served up a golden cross buy signal between the 50 day and 200 day moving averages, then it would appear all is set fair for a fresh leg to the upside. Just how high the stock could stretch is suggested by a one year line of resistance from this time last year, with the message now being that provided there is no end of day close back below the 50 day moving average at 6.75p, we could be looking at a target as high as 15p. The timeframe on such a move is regarded as being the next 2-3 months.
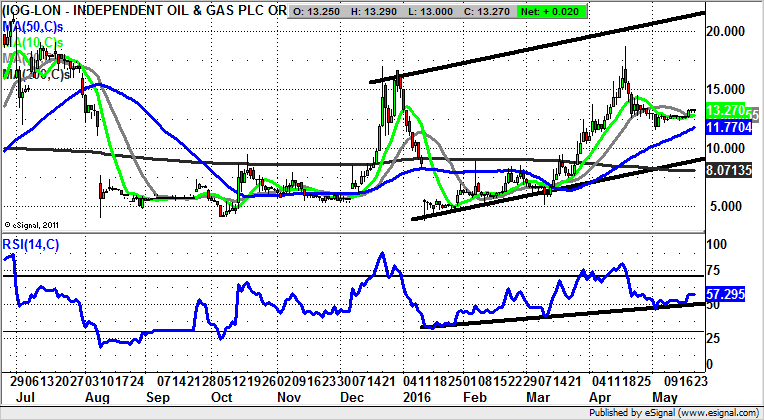
Independent Oil & Gas (IOG): 21p Price Channel Target
It would appear that the great turnaround for Independent Oil & Gas came from the way that the shares were able to revive from the exhaustion gap reversal in January which came in the wake of a gap down through the 50 day moving average now up to 11.62p. The 200 day moving average, still falling at 8.07p in March, was another key technical breakthrough. However, it is the 50 day line which is back in focus at the moment, with the likelihood now being that provided there is no end of day close back below the 50 day line one would be looking for significant upside. Just how high this could be is suggested by the top of a top of December rising trend channel as high as 21p. This could be witnessed as soon as the next 1-2 months, especially given the way that there has just been another rebound off an extended uptrend line in the RSI window from January at RSI 50 to leave it at 57.
Comments (0)