Zak’s Daily Round-Up: ADM, KGF, TSCO, WOS, KDR and PHE

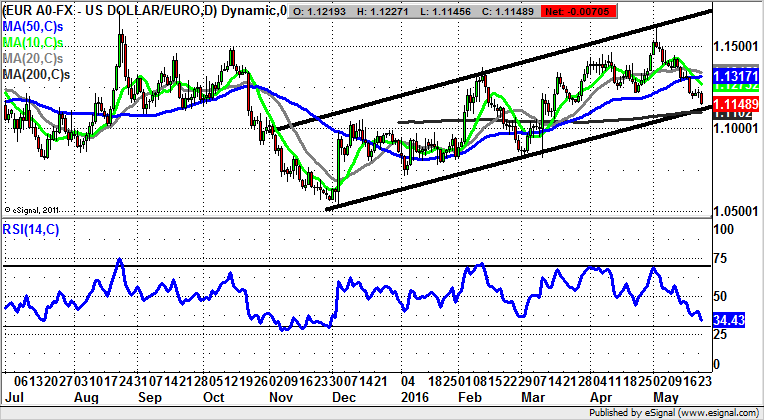
Market Direction: Euro/Dollar Initial 200 Day Line Support
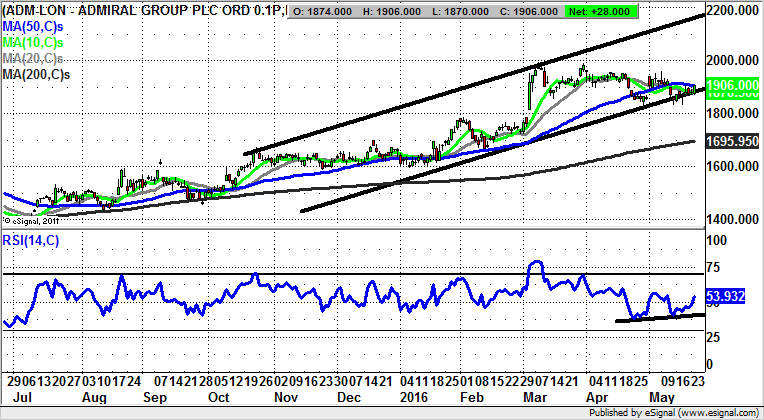
Admiral Group (ADM): October 2,200p Technical Target
What we can say in terms of the recent trajectory of the price action of the daily chart of Admiral Group is the way that this is a situation which is perhaps as robust as the bulls might have wished for. The reason for the relative enthusiasm is the rising trend channel which can be drawn in from as long ago as October, within which the shares have been surprisingly resilient. This point is underlined by the way that for May to date we have seen minor intraday probes below the price channel floor, but then a decent rebound as a gap fill event as well as the latest clearance of the 50 day moving average at 1,907p. The view now is that at least while there is no end of day close back below the October price channel floor at 1,880p, the upside here could be as great as the 2015 resistance line projection currently pointing as high as 2,200p. The timeframe on such a move is seen as being as soon as the next 4-6 weeks.
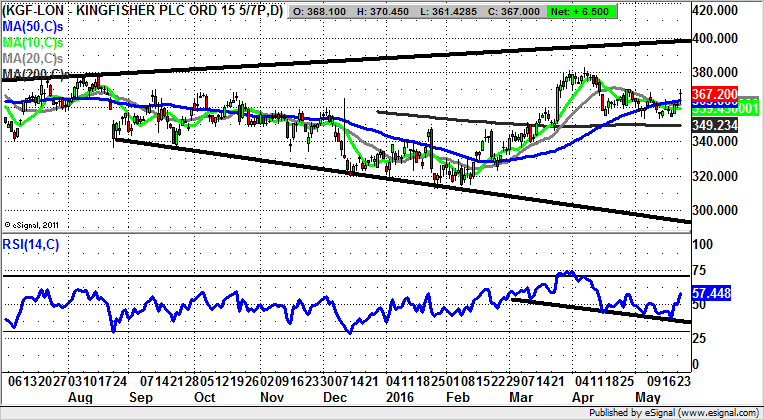
Kingfisher (KGF): December Rising Trend Channel
Perhaps the most interesting aspect regarding Kingfisher over the past year is the way that we were on the receiving end of an extended top formation for the post March period, but that since the start of this year the shares have apparently been of a mind to snap this negativity. Indeed, from March this year it can be seen that since the clearance of the 200 day moving average at 349p there have been multiple support points for the stock above this charting feature. The chances are now that the floor of a rising trend channel from December / 10 day moving average at 359p will be held and that while there is no end of day close back below this notional support we shall see at least an intermediate rally. The favoured destination at this point is regarded as being the 6 month resistance line projection currently heading as high as 410p. The timeframe on such a move is regarded as being the next 6-8 weeks.
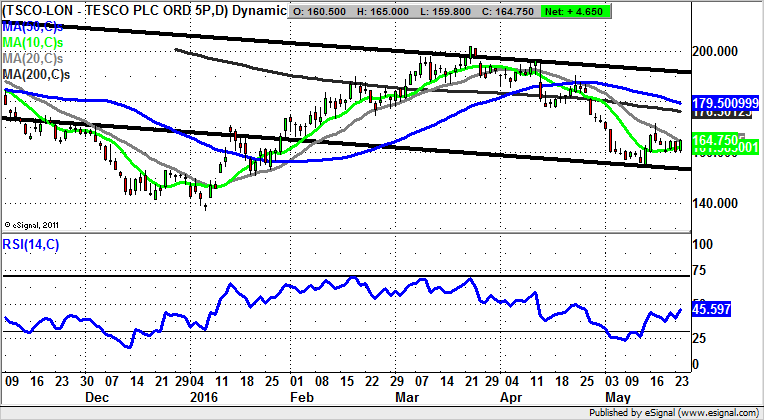
Tesco (TSCO): 200p Zone in Focus
While it may pay to dial down the enthusiasm for the near-term charting prospects of Tesco just a little, it is difficult to deny that the latest bounce for the shares does seem to be very encouraging indeed. This is said on the basis that we have been treated to a sharp rebound off what can be regarded as the right shoulder of an inverted head & shoulders formation. The formation has been in place since as long ago as September, with the added kicker being that for May to date the shares have found support some 5p above the floor of the January gap. All of this goes to suggest that provided there is no end of day close back below the latest 159p intraday floor for the shares, we could still see chunky upside. The favoured destination at this point is regarded as being the March resistance zone at 200p as soon as the end of June.
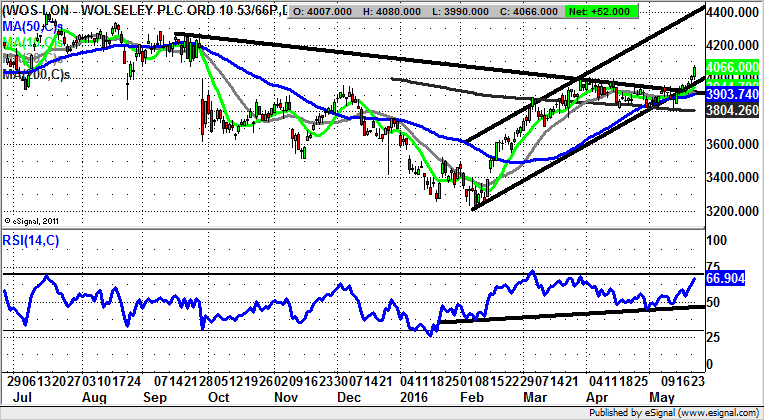
Wolseley (WOS): 4,400p Technical Target
There will be few who would deny that the daily chart action for Wolseley has been something of a fairground ride, given all the swings, the gaps and the breakouts. The latest here is that we have seen a break of a key resistance line which has been in place since as long ago as September last year. Ordinarily, given the massive top seen on the daily chart of the stock one would have been keen on the initial downturn of 2016 towards 3,200p continuing. However, the unfilled gap to the upside for February completed an island reversal formation, with this living up to the traditional strength and magnitude such setups have. On this basis, and in the wake of the latest breakout through 4,000p, one would be looking to a top of February price channel target as high as 4,400p. The timeframe on such a move is regarded as being as soon as the next 4-6 weeks.
Small Caps
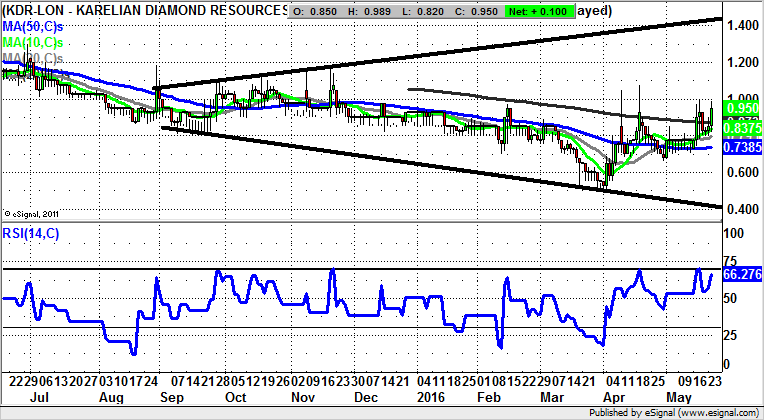
Karelian Diamond Resources (KDR): Broadening Triangle Points to 1.4p
While it may have been something of a wait for shares of Karelian Diamond Resources in terms of taking off, what can be seen on the daily chart here is the way that at least since the beginning of last month the stock has been able to consolidate close to the 50 day moving average at 0.73p, ahead of the clearance of the 200 day moving average at 0.87p. This allows us to believe that on a 2-3 month timeframe we may be heading to 1.4p at last year’s price channel top, especially while the 50 day line is held on an end of day close basis.
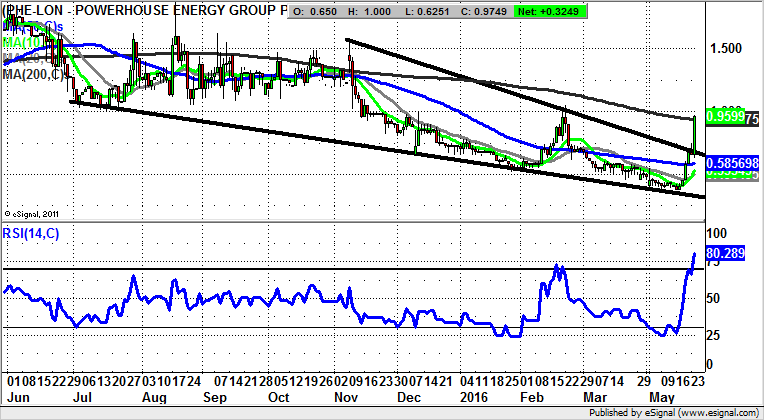
Powerhouse Energy (PHE): Bullish Wedge Breakout
There is something almost magical in terms of being ahead of the curve when there is a wedge breakout, such as we are currently seeing on the daily chart of Powerhouse Energy. This is particularly the case given the way that both November and in particular, February served up false dawn moves which turned out to be bull traps. However, this month’s revival was flagged by the bullish divergence in the RSI window, as well as the extended rebound off the July falling wedge pattern. All of this goes to suggest now that at least while there is no end of day close back below the top of the wedge at 0.7p, we could see significant fresh upside. This is despite all the gains seen to date, and the way that the RSI at 80/100 is significantly overbought. The choice is therefore to look to buying dips towards the 0.7p zone, or wait for a momentum buy trigger on a break of the former February resistance at 1.04p. At this stage only a weekly close back below the 50 day moving average at 0.58p is regarded as questioning the recovery argument.
Comments (0)