Zak’s Daily Round-Up: AAL, GLEN, MKS, AVO and IOF

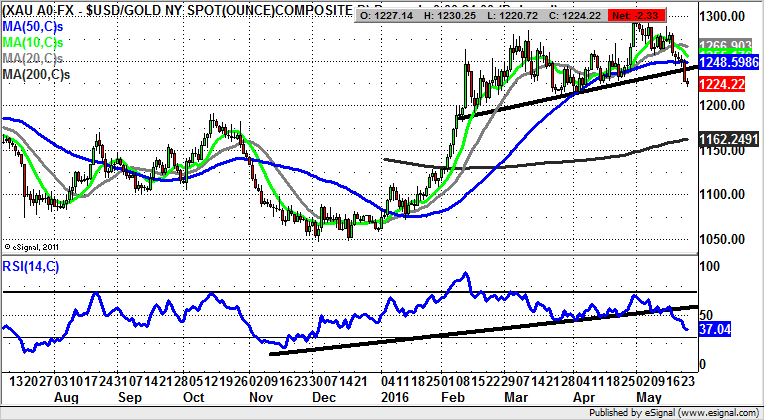
Market Direction: Gold Loss of $1,240 Risks towards $1,160
Anglo American (AAL): 570p Support Zone
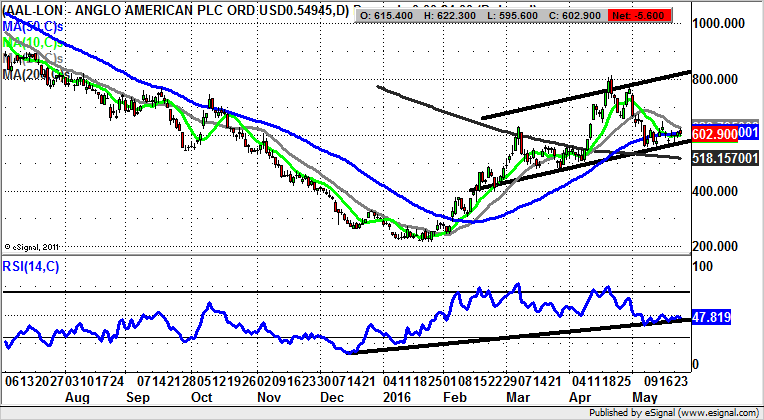
In many ways Anglo American shares have over the past six months and more demonstrated how a classic positive reversal works from a charting perspective. This is because the big turnaround was kicked off by a December–February inverted head & shoulders formation which included an island reversal. The last part of this formation included an as yet unfilled gap to the upside, through the 50 day moving average, then at 300p and now at 607p. Such gaps through the 50 day line very often lead the biggest of bull moves, and it can be seen how this has been the case at Anglo American, as it progressed within a rising trend channel which can be drawn in from as long ago as February. The floor of the channel currently runs at 570p, with the expectation being that provided there is no end of day close back below this level, one would be looking for a decent resumption of the overall rally since the beginning of the year. The favoured scenario is for a retest of the best levels of the year to date above 800p, also April highs, over the next 1-2 months. At this stage, only a weekly close back below the still falling 200 day moving average at 619p would really scupper the idea that this is a prime bullish situation.
Glencore (GLEN): Support above 200 Day Line
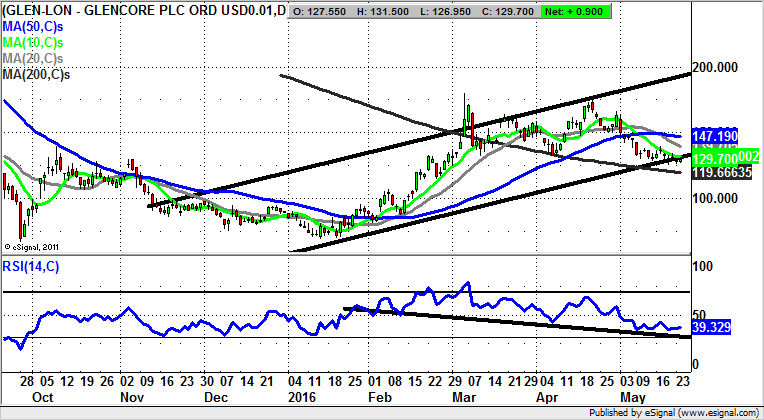
Given this week’s surge for the FTSE 100, it may pay to look at some of the stocks in the index where we have been treated to mixed price action of late and try to work out whether the technical glass for situations like Glencore is half empty or half full. What can be said of the present setup is that we are rather obliged to give the benefit of the doubt to the price action while the shares remain above the 200 day moving average at 119.66p. There is also the backing of an extended RSI support line since the end of January. Both of these features could combine to underpin the shares and make them a buy on dips provided there is no end of day close back below the 200 day line. Otherwise, cautious traders might wish to wait on an end of day close back above the 10 day moving average at 131.74p as a momentum buy trigger, especially since this feature has capped the price action over the course of May to date. As for what the upside here may be, we are anticipating an initial upside at the 50 day moving average at 147p, with the technicals after that still pointing as high as 195p. This target is derived from the resistance line projection of a rising trend channel which can be drawn in from as long ago as November.
Mark & Spencer (MKS): 500p Price Channel Target
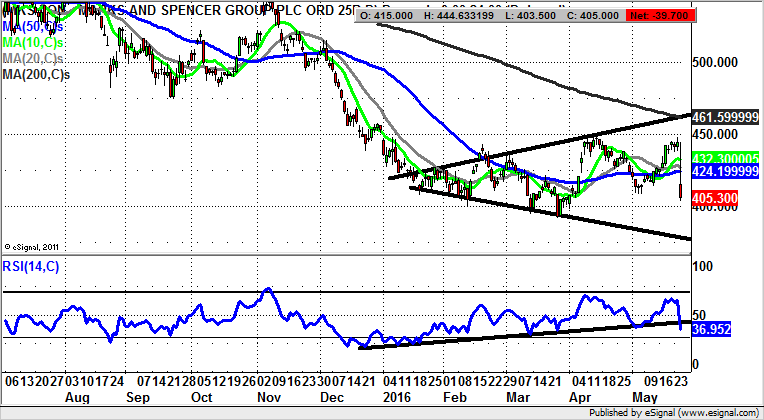
As usual with the big companies reporting, it is almost a case of pick your news source to get everything between there being a good update or a bad one. For instance, the accusation on totally politically neutral (Remain) BBC Radio 4’s Today programme was that M&S had nearly offered a profits warning, whereas a leading spread betting company (not allowed to give investment advice) suggested that middle England’s favourite grocer had beaten estimates – admittedly not really investment advice. As far as the charting picture is concerned here, it can be seen how there has been an extended base in place on the daily chart since February. This has taken the form of an inverted head & shoulders. The assumption to make now is that in the wake of an end of day close back below the 50 day moving average at 424p and below the December price channel floor at 420p, as seems most likely today, one would suggest a final dip below 400p at 2016 support is required before any sustained recovery can get under way. Only back above the 50 day line, ideally on a weekly close basis, would really hint that a journey back towards the top of the recent 400p – 450p zone is on the cards any time soon.
Small Caps
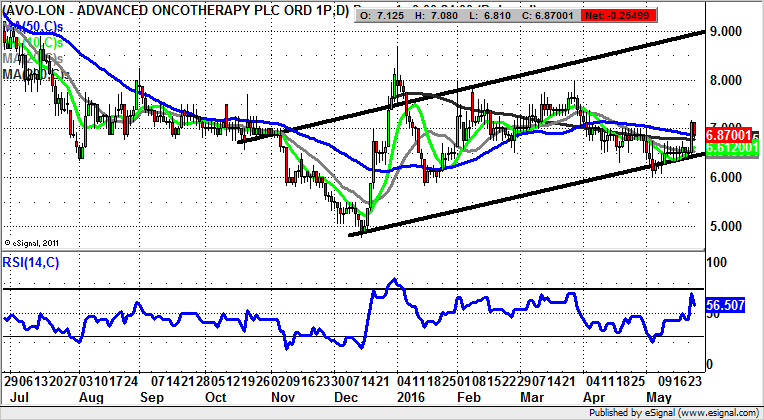
Advanced Oncotherapy (AVO): Above December Line Targets 9p
It would appear that for shares of Advanced Oncotherapy we have been looking at an extended period of consolidation which has dominated the scene since the sharp December rally from 5p to 8p plus. What has been helpful since then is the way that on two occasions we have seen support come in towards 6p, firstly in January and earlier this month. The conclusion to draw is that the stock could be in a rising trend channel which has backed the price action since as long ago as the beginning of December. The hope now is that while the December uptrend line remains in place at 6.5p, the upside here should be towards the 9p zone – over the next 1-2 months.
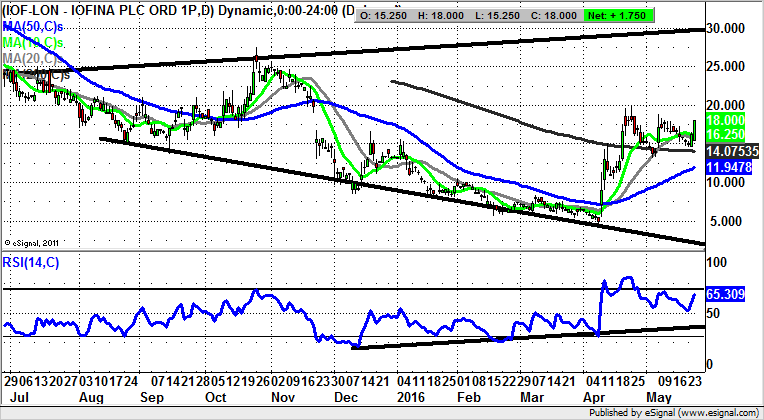
Iofina (IOF): Triangle Points to 30p
What can be said about the Iofina daily chart over the past couple of months is that although the April turnaround initially appeared to be something of a flash in the pan affair, since then the stock has consolidated it very well indeed. This is said in the wake of the fact that the 50 day line did not need to be tested as new support after it was broken, and that new support has come in towards the 200 day moving average, now at 14.07p. At least while above this feature on an end of day close basis one would be looking to a fresh leg to the upside, with the target being as great as the top of a broadening triangle in place on the daily chart since July last year. Only cautious traders would wait on a clearance of the April 20p resistance before taking the plunge on the upside, or simply waiting on dips towards the 200 day line to improve the risk/reward of going long.
Comments (0)