Metals Exploration: Wedge formation could lead back to 5p plus

It is usually not wise to catch a falling knife in the financial markets, or indeed, anywhere else. But the example of Metals Exploration (LON:MTL) does suggest that sometimes rules are there to be broken.
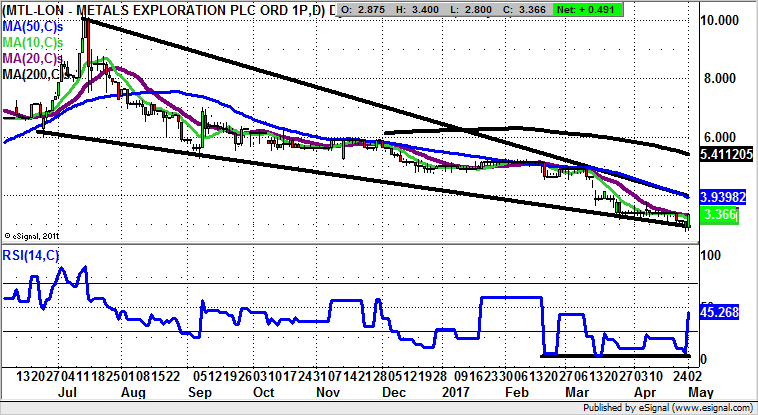
What can be seen on the daily chart of Metals Exploration is that the post-July 2016 period has, to date, not been a happy one. While this may continue to be the case, there is enough for forensic chartists to suggest we may have seen the worst for this particular minnow. What helps as far as the fundamentals are concerned is the way it is possible to draw a falling wedge that has been in place since last summer, with the stock bouncing sharply off the floor of the formation once again today.
The quarterly update from the gold miner seems to have been a decent fundamental trigger on April 24th, in the sense that despite the company making slow progress the yellow metal is being poured. Cynics such as myself might be able to quip that while there may only be small quantities of gold produced at the group’s Runruno mine in the Philipinnes, this is considerably more than the promises many other companies make in this space.
From a technical perspective, apart from the wedge rebound there has been a triple bullish divergence rebound for the RSI indicator off a line of support in place from as long ago as February. This should be enough to catapult the share price towards the area of the 200 day moving average at 5p plus over the next 4-6 weeks.

Comments (0)