Chart of the Day: Savannah Resources

The shares of mining minnow Savannah Resources have experienced something of a transformation in recent months, helped by the turnaround in the sector as well as internal progress by the company…
Savannah Resources (SAV): As High As 5p Initially
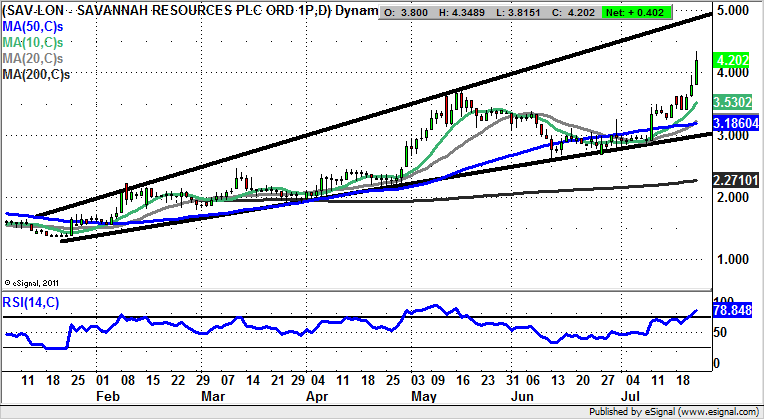
Interestingly, with Savannah Resources we have a stock where the market was rather reluctant to look on the bright side, even as recently as January, but which now seems to be very much in the box seat in terms of sentiment and expectations. All of this can be seen on the daily chart of the multi commodity group, especially after the newcomers to the board were announced recently. The overall technical pattern here is progress within a broadening triangle in place since the end of January. This has guided the stock up from below 1.5p to over 4p now, but even after all the gains and with the RSI on the overbought side, we could still be treated to a final near-term push higher. The favoured destination in this respect is the 2016 resistance line projection, currently heading as high as 5p. This could be hit over the next 2-4 weeks. As far as money management is concerned one can say that only a weekly close back below the initial July resistance at 3.45p would be of concern to the bull argument, with any initial dips back towards this area regarded as buying opportunities.

Comments (0)