Chart of the Day: Red Rock Resources

It is perhaps only natural that the life of a small cap stock will see it go from zero to hero and back again several times. On this basis a company like Red Rock Resources is always worth keeping on the watchlist – a point underlined by the company’s present technical position.
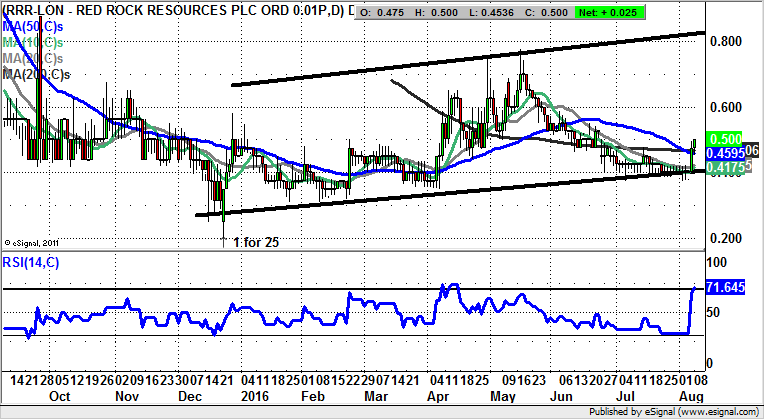
Red Rock Resources (RRR): 200 Day Line Clearance Suggests Back To 0.8p
2016 to date has seen mining stocks of all shapes and sizes go into recovery mode. This has been the case from the aftermath of a final selling climax dip in December from below 0.2p. Since then we have been treated to progress within a rising trend channel, one which can be drawn in from as long ago as the end of last year. The floor of the channel currently runs at 0.4p, with the message being that provided there is no end of week close back below this, the notional upside should be as great as the late 2015 resistance line projection point at 0.8p. This could be seen as soon as the end of next month, especially now given the way there has been a decent clearance of both the 50 day and 200 day lines at just above 0.45p. What is particularly interesting is that the latest rebound has actually had the effect of breaking the initial August dead cross sell signal. Indeed, the break of such a technical signal reinforces the turnaround argument here, even without including the Metal Tiger (MTR) factor.
Comments (0)