Chart of the Day: GKN

While it may be the case that the notion we could see more on the bid front after ARM Holdings (ARM) received M&A attention is a little farfetched, the attractions of Best of British might just see a few more companies in the takeover spotlight.
GKN (GKN): Above 200 Day Line Targets 320p
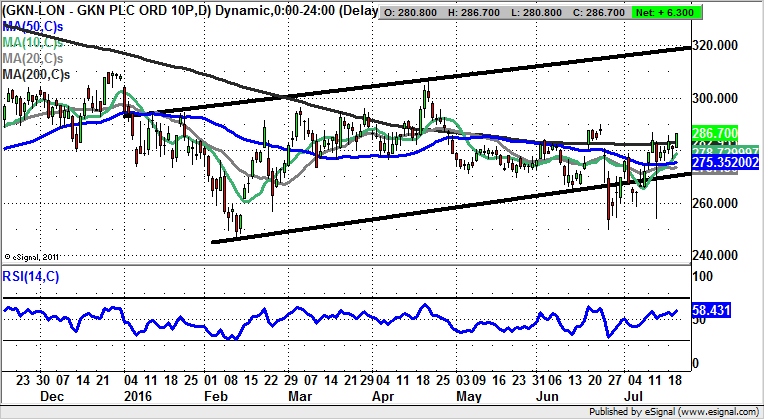
If there is a going to be a flurry of M&A post Brexit vote it may be worth looking at the companies which really do represent niche areas of business, as well as those who could do even better as part of a true multinational player. In the case of GKN it can be seen how we have been treated to a strong break above the 200 day moving average, now at 282p, after higher lows versus February for June and July. All of this would go to suggest that we could be treated to significant upside, provided there is no end of day close back below the floor of the rising trend channel in place on the daily chart since the beginning of the year at 270p. The favoured destination at this point is currently regarded as being the 2016 resistance line projection, now pointing at a notional 320p target. The timeframe on such a move could be as soon as the end of August. In the meantime, cautious traders could wait on either buying dips towards the 270p zone or on a weekly close above the 200 day line on Friday, just to make sure decent momentum is in force here.

Comments (0)