Chart of the Day: G4S

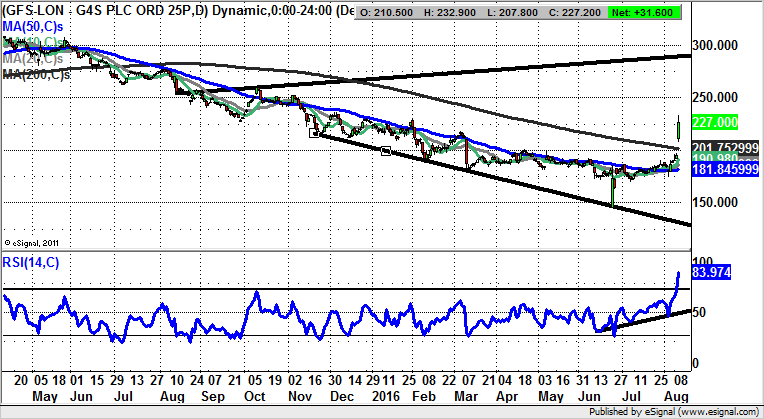
Looking at the daily chart of G4S, we have a disturbingly accurate picture of the perceived fundamentals of the company, at least in term of sentiment amongst investors. The question now in the wake of today’s chart gap is whether this is the lasting turnaround the bulls have been waiting on?
G4S (GFS): Broadening Triangle Target towards 290p
It may be said quite fairly that despite the commanding position security group G4S has in its sector, over the bulk of the past five years fans of this company have been in the metaphorical doghouse. Mishap has seemingly followed mishap. However, one of the rules of technical analysis is that below the 200 day moving average is bearish, and above it bullish, with this message being hit home hard today. This is because the stock has cleared the 200 day line now at 201p with sharp momentum, and with a decent unfilled gap to the upside. All of this comes in the aftermath of a deep one day bear trap rebound on June 24 in the wake of the Brexit vote, a vicious stop loss hitting event for the longs. The gap for August, though, suggests that the bulls are ready to twist the knife into the pessimists. This view is backed by the way we have seen a June uptrend line drag the RSI indicator higher – with the line now based at the neutral 50 level. The assumption to make now is that while there is no end of day close back below the 200 day line we should be treated to a top of the broadening trend channel from this time last year with its resistance line projection currently heading as high as 290p. The time frame on such a move is regarded as being the next 1-2 months or less.

Comments (0)