Zak’s Weekend Charts Round-Up

FTSE 100 Stocks
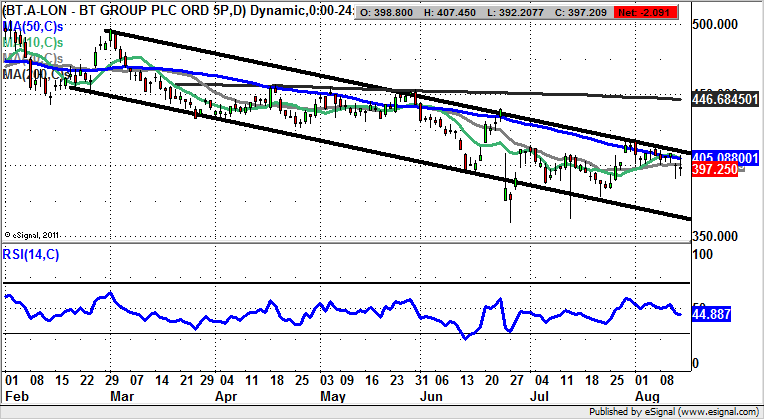
BT Group (BT.A): Below 50 Day Line Targets 360p
It would appear that while the wrangle between Ofcom and BT Group over Openreach may be still in the former state monopoly’s favour, the market seems to be concerned the issue may be resolved against the telecoms group. This can be seen on the daily chart where there has been a descending price channel in place since as long ago as February. What is particularly of note here is the way that for August to date we have suffered multiple failures at the top of the channel / 50 day moving average at 405p. The message at the moment is that provided there is no end of day close back above the 50 day line we should be prepared for a new leg to the downside. The favoured destination would then be 360p at the 2016 support line projection. The timeframe on such a move is regarded as being as soon as the next 1-2 months.
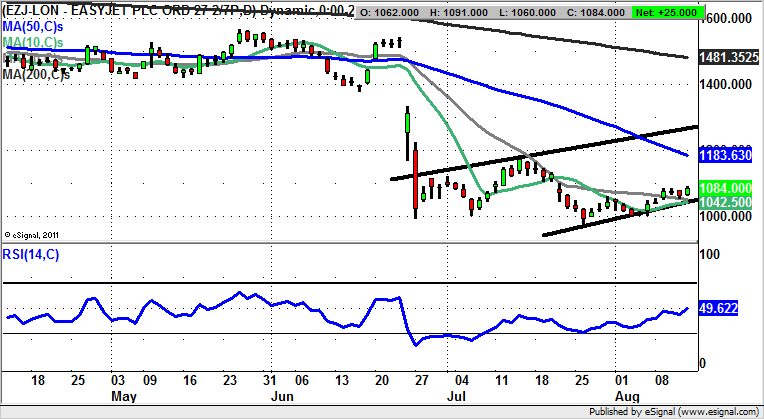
EasyJet (EZJ): Quadruple Support
For shares of EasyJet we have a combination of an intriguing chart pattern and the bullish divergence in the RSI window from the big dip in the stock over the course of June. Of course, the real challenge here has been the interplay between the price action and the fundamentals. Ironically, it could be the case that this Remain-friendly company has actually taken too bearish an angle on its prospects – effectively shooting itself in the foot via an extended lament. What is a standout for starters is the quadruple bottom which looks as though it may be as robust as the implied setup should be. This is especially the case given the higher low for August versus the July selling climax. What the bulls will hope for now is no end of day close back below the 10 day moving average at 1,044p / June price channel floor, ahead of further recovery. The initial target here is the 50 day moving average at 1,183p over the next couple of weeks. The best case scenario destination for EasyJet over the next month would be the top of the June channel, currently pointing towards the 1,270p level.
Marks & Spencer (MKS): Above 50 Day Line Targets 400p Plus
Around the turn of the month I remember being intrigued by the daily chart price action of M&S given the way that the stock appeared to have almost ground to a halt in the mid 320s. The theory was that the shares were consolidating in a positive fashion, at the floor of a rising trend channel which could be drawn in from the end of June. Indeed, equivalent channels have been drawn on many FTSE 350 stocks, providing backing for the idea that this is a bullish contender. The present position is that we are looking at a clean break of the 50 day moving average at 333p. The suggestion is that provided there is no end of day close back below this feature we should be on the receiving end of a journey towards the June price channel top / 200 day moving average at 414p. In the meantime, any dips towards the 330s to improve the risk / reward can be regarded as a buying opportunity.

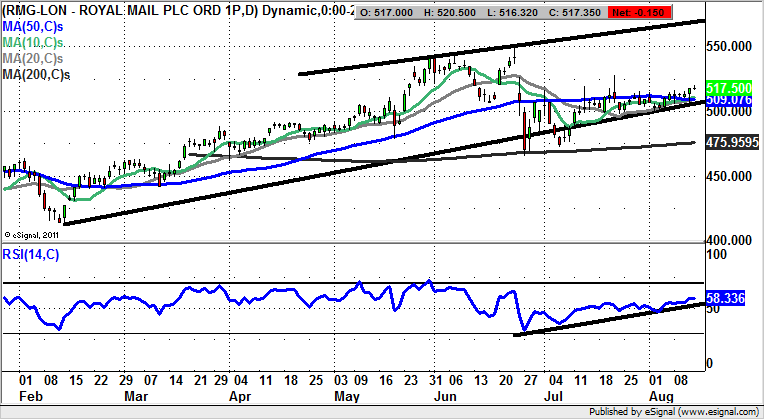
Royal Mail Group (RMG): Above 500p Could Lead To 570p
As far as slow burn recoveries are concerned it may be said that the journey here at Royal Mail Group has been rather slower than one might have expected. This is said in the wake of the February bear trap gap reversal, which was soon followed the next month by the recovery of the 200 day moving average at 475p. Since then in fact, we have seen the 200 day line come in as support almost continuously. Closer to the price action now, we are looking at a consolidation towards the floor of a rising trend channel from February, currently running at 509p. At least while there is no break back below the 500p zone one would be relatively confident that the post February flow higher will continue. The favoured 1-2 month destination for Royal Mail is regarded as being the 2016 resistance line projection as high as 570p.
Small Caps
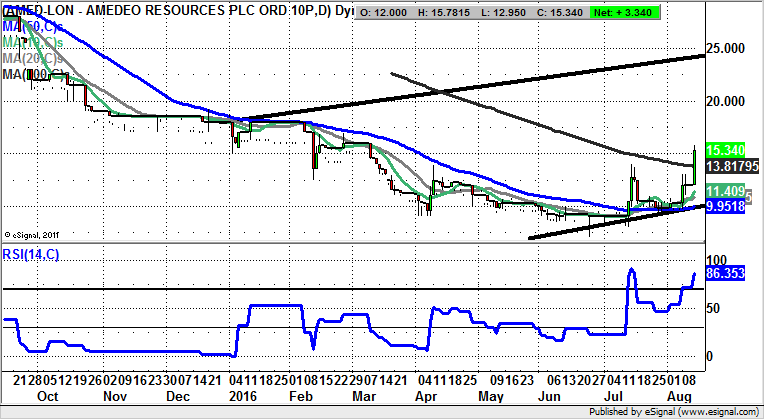
Amedeo Resources (AMED): Above 200 Day Line Targets 25p
Amedeo Resources has been on the radar for a month or so since the recovery of the 50 day moving average at 9.94p last month. Since then we have been treated to a decent sideways consolidation at and above the 50 day line, with this feature also representing the floor of a rising trend channel which can be drawn from as long ago as the beginning of the year. The likelihood now in the wake of the weekly close above the 200 day moving average at 13.81p is that we can start mapping out a 2016 resistance line projection target as high as 25p on a 1-2 months timeframe. However, given that the RSI at 85p is extremely overbought, one might prefer to look to buy into any weakness back towards the 200 day line – something which would also improve the risk / reward of going long.
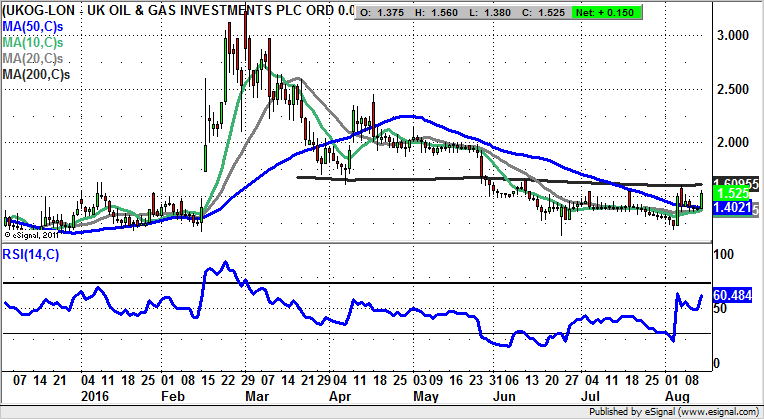
UK Oil & Gas (UKOG): Above 200 Day Line Suggests 2.5p Again
It is now a couple of weeks since the alleged forced seller (I read it on Twitter), and it would appear that the price action here has improved in favour of the bulls, although we are still awaiting a confirmation trigger. This should come in the form of an end of day close above the 200 day moving average, now at 1.60p. If we get this over the next few sessions the expected upside is back towards the post April resistance at 2.5p over the following 1 – 2 months. As for the stop loss, the 1.27p initial August low looks to be appropriate, although the ideal scenario is that there is no sustained price action back below the 50 day moving average at 1.40p and the RSI 50 level versus 60 at the moment.
Comments (0)