Chart of the Day: Lloyds Banking

Lloyds Banking (LLOY): Share Sale or No Share Sale?
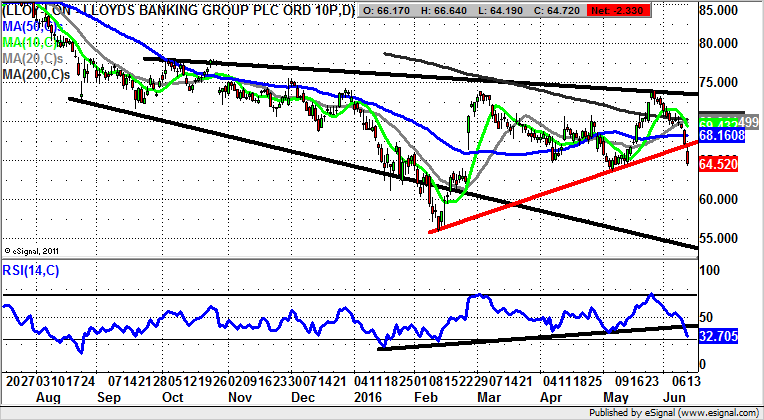
I have to confess finding it highly amusing that every time the Government, mainly in the form of Chancellor Osborne, gets close to selling the remainder of its stake in Lloyds Banking, the stock market tanks. True, the run up to the June 23 Referendum has rather upset the apple cart as far as the stock market in general is concerned, especially the main financial plays. This has manifested itself with a gap down on the daily chart of Lloyds Banking shares through an uptrend line which can be drawn in from as long ago as February. The risk now is that provided there is no break back above the 50 day moving average at 68p we could see an accelerating decline.
This idea is backed up by the way that there has also been a break of an uptrend line in the RSI window at 40/100, in place from as long ago as January. The worst case scenario target on the downside at this stage is seen as being a move down to the floor of a broadening triangle in place from as long ago as August last year. In the meantime any slight rebound back towards the top of the gap at 67p can be regarded as a shorting opportunity.

Comments (0)