Zak’s Weekend Charts Round-Up

FTSE 100 Stocks
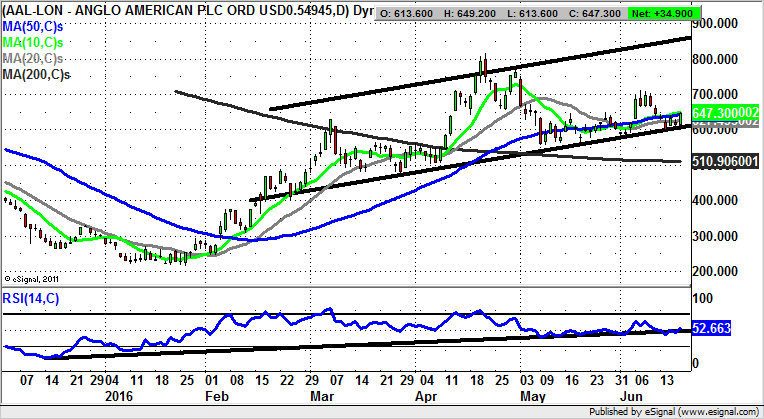
Anglo American (AAL): Price Channel Support
It would appear that there are at least a couple of major influences on Anglo American over and above the strength of the Chinese economy, the biggest customer of all the leading mining stocks. They are where the FTSE 100 is, and of course where the leading metals are trading. Therefore, with gold having nudged above $1,300 an ounce this week again, we are looking at a potential base area for the stock after the pullback from both April and June resistance. What can be seen currently is the way there is a decent consolidation at the floor of a rising trend channel which can be drawn in from as long ago as February. The floor of the channel in terms of the uptrend line runs at 610p, with the message at the moment being that while there is no end of day close back below this feature one would be looking for considerable upside. Just how much this could be is suggested by the five month resistance line projection pointing as high as 870p. The timeframe on such a move is regarded as being as soon as the end of next month. This is particularly so given the latest bounce off an extended uptrend line in the RSI window which has been in place since December. It runs at the neutral 50 / 100 level, usually a good location in terms of being a leading indication on new upside. Only cautious traders would wait on an end of day close above the 10 day moving average at 648p before taking the plunge on the upside.
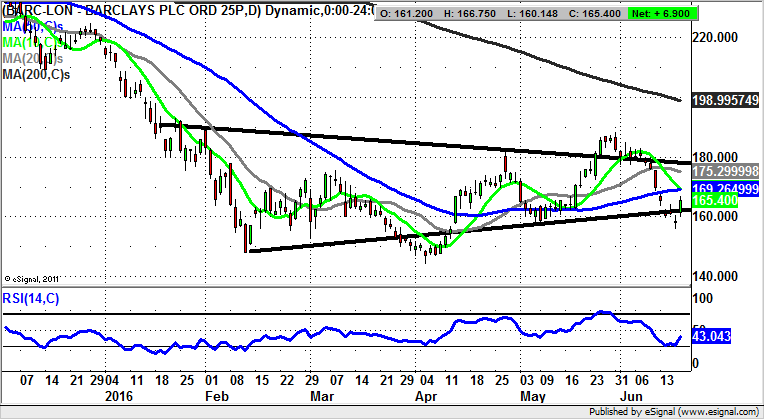
Barclays (BARC): Converging Triangle Support
The UK banking sector remains an area which divides opinion sharply on a fundamental basis, with perhaps the only thing most can agree on being that at least it is in a better state than most of their Eurozone counterparts. The present position on the daily chart of Barclays shows how there has been the expected pullback from the post April resistance zone above 180p. However, the bulls look to have been saved initially by the floor of a converging triangle which can be drawn in on the daily chart from as long ago as January. Also useful in terms of the price action and choosing the correct stop loss is the way that June has so far delivered a bear trap rebound from below the 158p floor of May. Indeed, the low of 155p just filled the floor of the gap from April before a classic gap fill rebound. The likelihood now is that provided there is no end of day close back below 155p we should be treated to a retest of the 180p plus range highs of the past couple of months. Only cautious traders would wait on a clearance of RSI 50, or the 50 day moving average at 169p before taking the plunge on the upside.
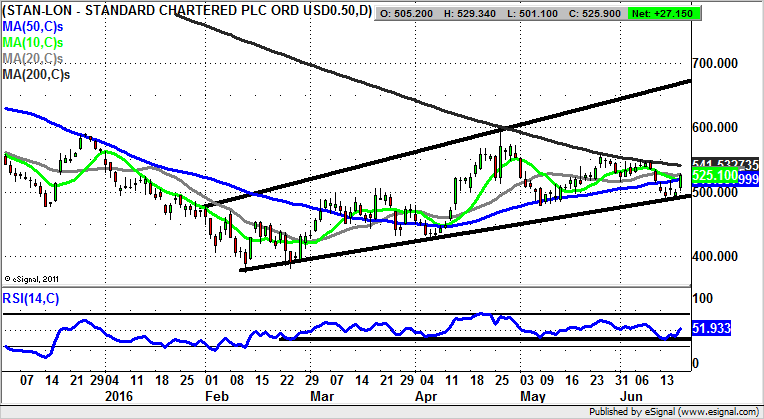
Standard Chartered (STAN): 670p Broadening Triangle Target
The ultra volatile situation with reference to China and the Far East/emerging markets makes it a great candidate for those looking for a challenging situation to apply some technical analysis. This point is underlined by the way that over the recent past we have seen a tentative recovery attempt in the post February period. The present position is that the shares have just bounced off the main 2016 support line, a feature which is running at 495p. This provides us with a decent risk/reward buy offering as we see a target which could be as great as the top of a broadening triangle which has been in place since as long ago as the early part of this year. Indeed, the chart pattern suggests there could be a move as high as 670p by the end of July, especially if the 200 day moving average, now at 541p, is cleared quickly over the next few sessions. In fact, it could be the case that cautious traders wait on a clearance of the 200 day line before pressing the buy button.
Small Caps
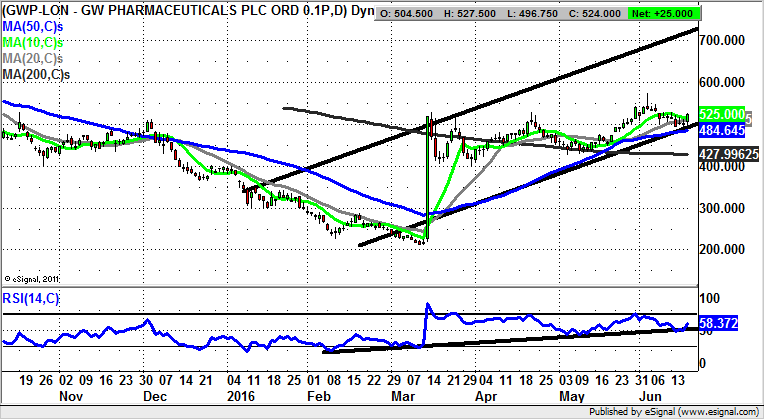
GW Pharmaceuticals (GWP): 710p Price Channel Target
It is interesting that there are some very healthy looking small cap set ups around at the moment, which is certainly something that applies to what we are currently witnessing on the daily chart of GW Pharmaceuticals. In fact, the real attraction here for the bulls is the way it is possible to draw a rising trend channel from as long ago as January, with the floor of the channel running level with the 50 day moving average at 484p. This provides notional double support for the stock, so much so that we can say that provided there is no end of day close back below the 50 day line one can look forward to decent upside. Just how high GW Pharmaceuticals could fly is suggested by the 2016 resistance line projection heading for 710p. This is the 1-2 months timeframe destination.
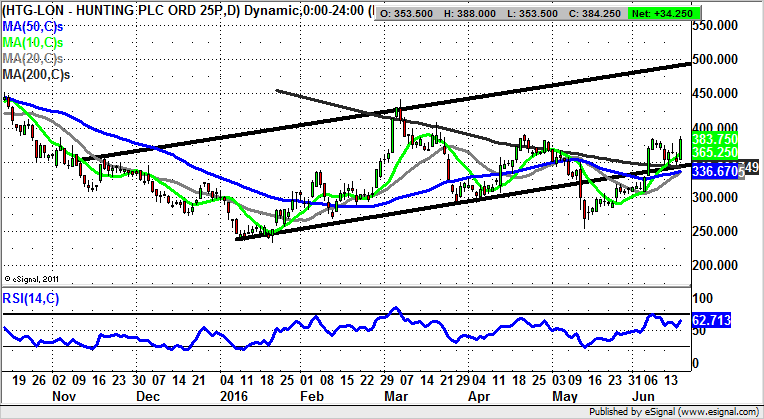
Hunting (HTG): Bull Flag Implies 500p
Hunting has been a rather difficult contender from a technical basis, with this point underlined by the way that May delivered a bear trap rebound from below March and February support. What was also interesting was the way that last month’s floor represented an almost exact gap fill rebound off the floor of the January gap at 253p. Given the way that there has also been a significant bounce in the wake of this signal one might be cautious in terms of following up on the long side here. But the charting message at the moment is that provided there is no end of day close back below the 200 day moving average at 343p one would be reasonably confident of a push to the top of a rising trend channel from November at 500p as soon as the end of next month. In the meantime any dips towards the 10 day moving average at 364p to improve the risk/reward of being long can be regarded as buying opportunities.
Comments (0)