Zak’s Daily Round-Up: SBRY, SHP, SN., APH and CRX

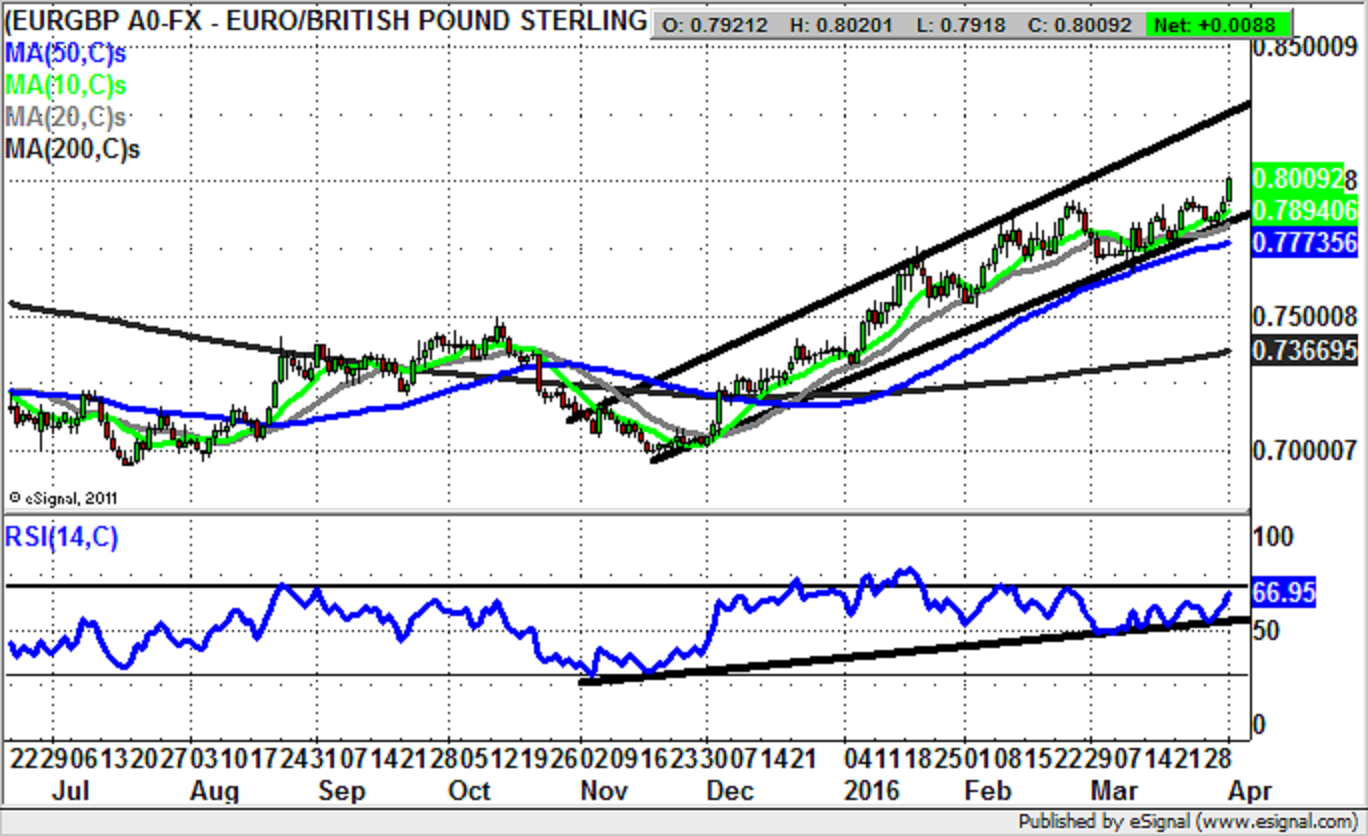
Market Direction: Euro/Sterling above 50 Day Line Targets 83p
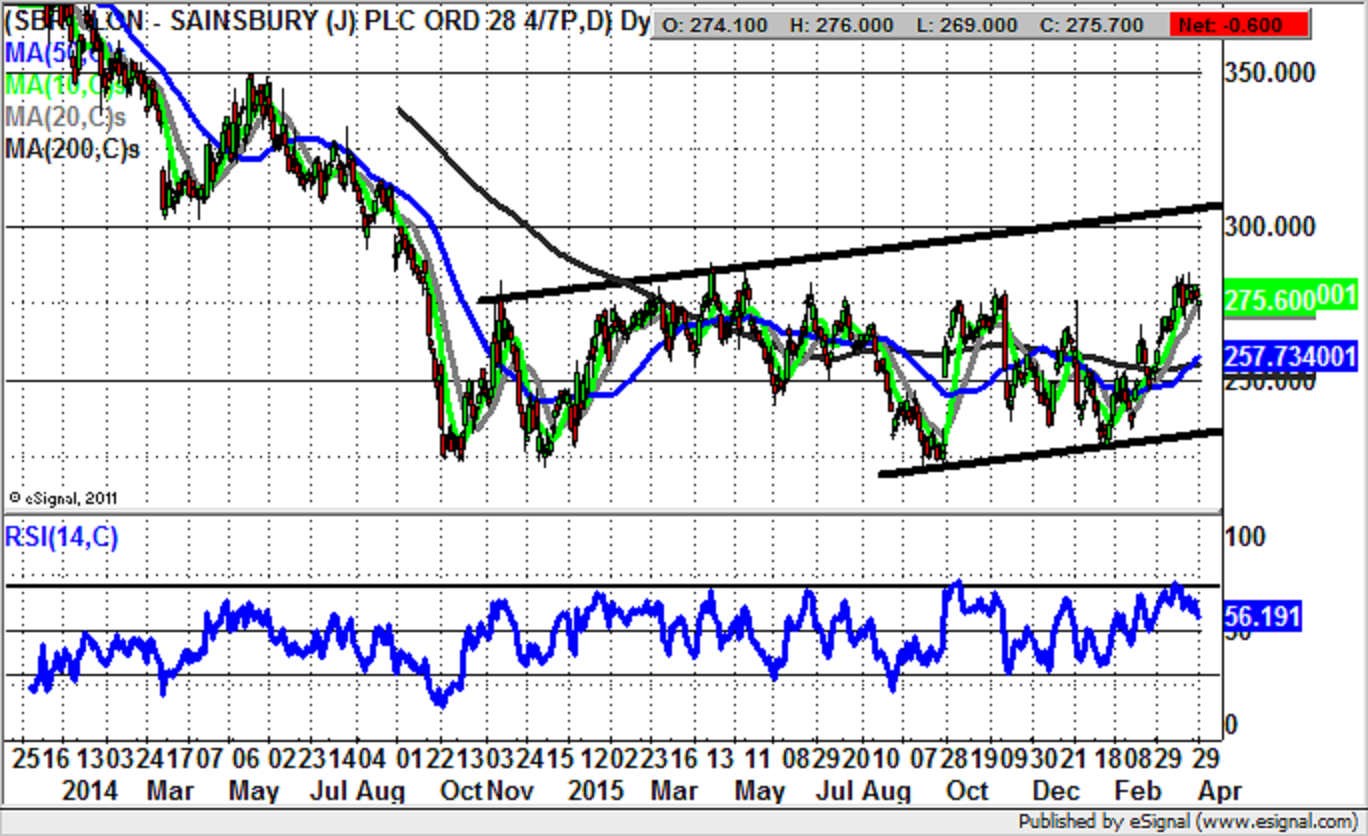
Sainsbury (SBRY): M&A Is Supportive
So it is all agreed: a recommended offer for Home Retail Group is costing Sainsbury £1.4bn. It might have been said by some – myself included – that one of the UK’s larger grocers could have made moves to create its own Argos. However, it may have been the case that from a cash perspective the prospect of buying Home Retail Group was in the end just too appealing. We shall see. On the charting side we see how there has been a decent recovery over the past few months, as the market began to come to terms with this particular M&A story. Indeed, it can be seen how there was a higher support point put in for January than the equivalent 221p September floor. But it is actually the case that the shares started their slow burn to the upside as long ago as the beginning of the autumn, with a large gap to the upside. This was through the 50 day moving average then at 245p at the end of September. The position now is that we see Sainsbury shares trading in the wake of a late March golden cross buy signal between the 50 day and 200 day moving averages now just above 255p. This came after yet another gap to the upside in February, which remains unfilled towards 240p. The view now is that provided there is no end of day close back below the 50 day line now at 257p, one would be looking for reasonable upside here. The favoured destination at this point is seen as being the top of a wide rising trend channel from the autumn of 2014. Its resistance line projection is headed as high as 305p, and this is the one to two months price target.
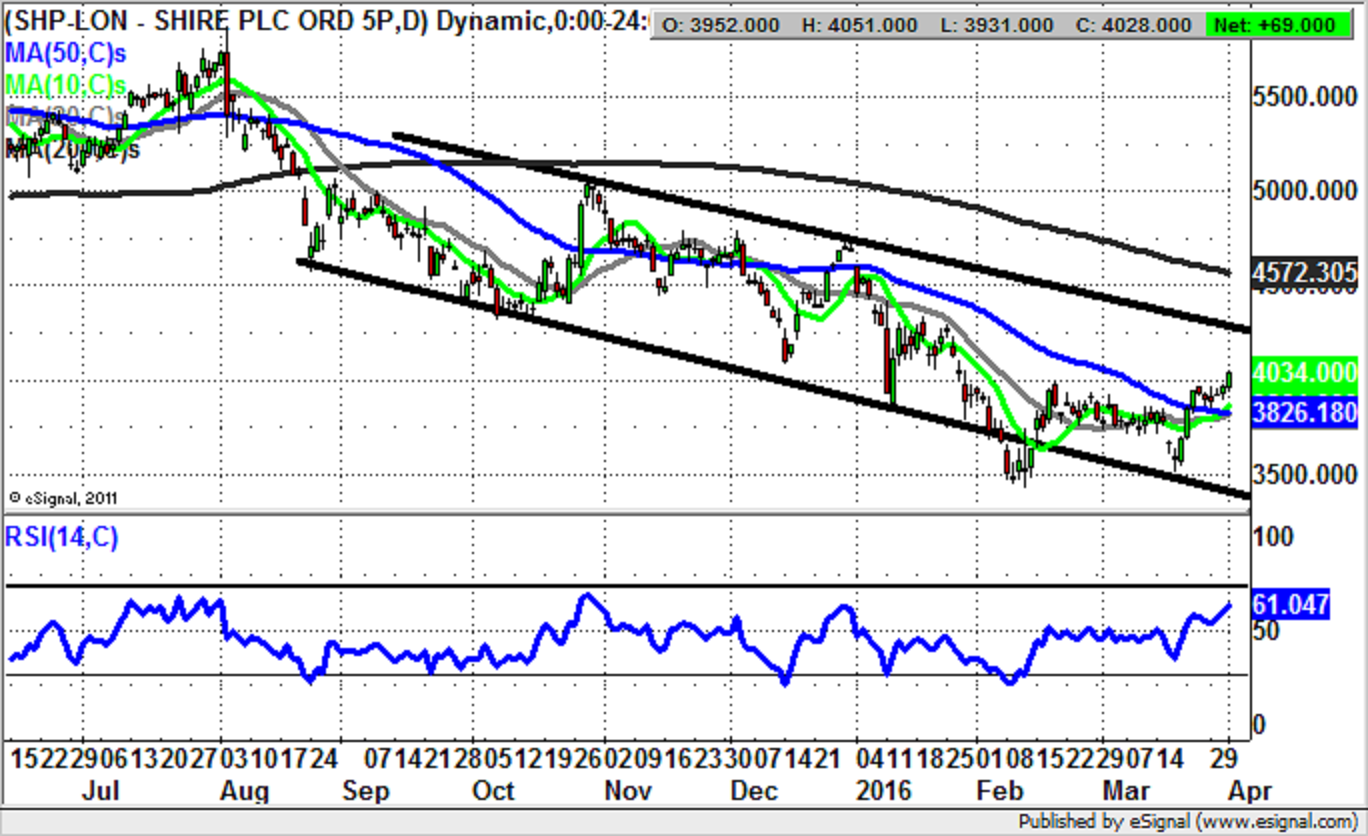
Shire (SHP): Support above 50 Day Line
Although the fundamentals for specialist drugs giant Shire would appear to be as robust as ever, this has not prevented the share’s rise and fall with the slings and arrows of stock market sentiment. This can be seen on the daily chart – especially since the summer, where we have a descent within a falling trend channel which can be drawn since August. What is interesting with regard to the price action since early February is the way that there has been a clear higher low above 3,500p – actually an exhaustion gap reversal. All of this combined with a clearance of RSI 50 and the 50 day moving average at 3,826p implies that further progress to the upside will be seen over the next month. What particularly helps is the way recent neckline resistance has been broken at 4,000p. This should allow Shire to squeeze up to the area of the 200 day moving average now at 4,572p – roughly the area of initial 2016 resistance. At this stage only sustained price action back below the 50 day line implies that there will be any significant delay to the upside scenario.
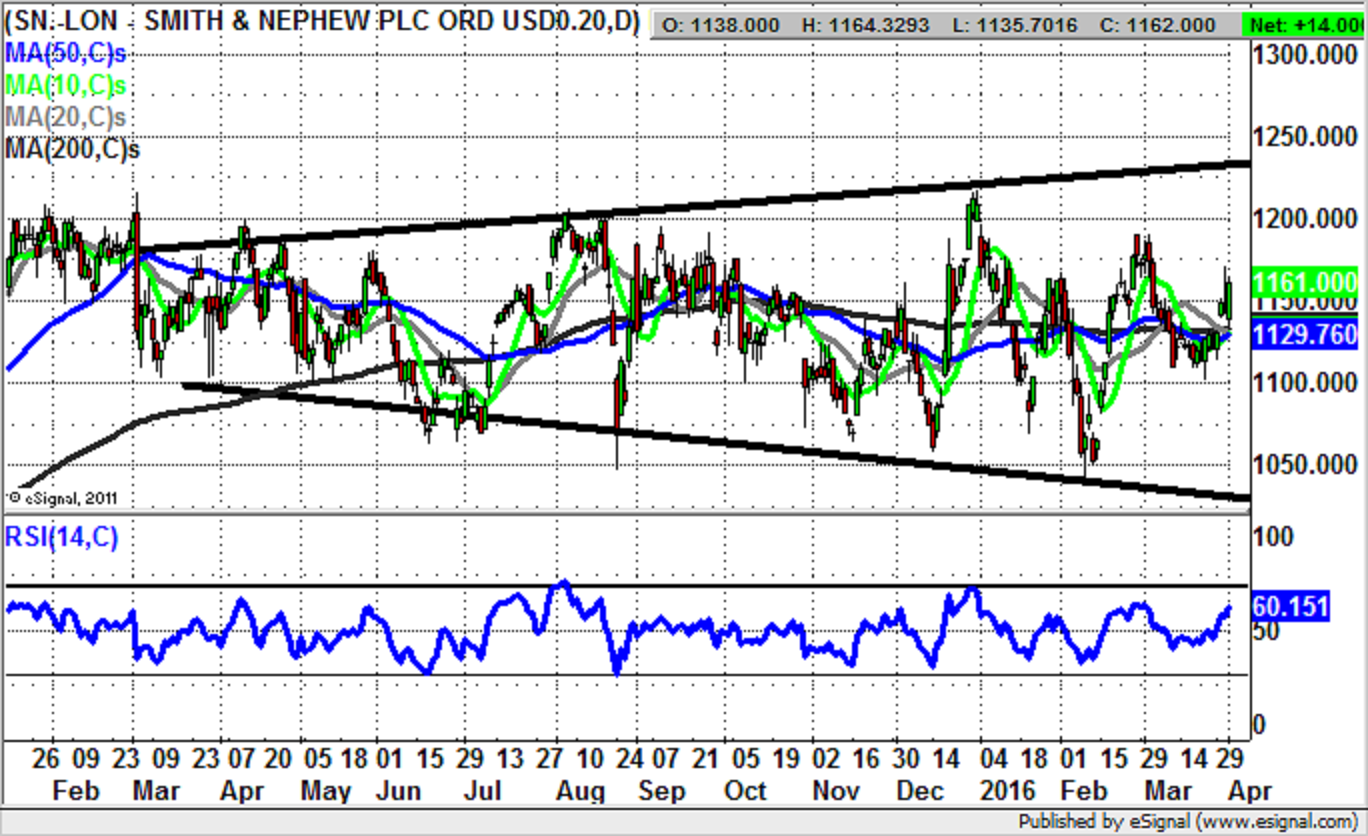
Smith & Nephew (SN.): Gap through 50 Day Moving Average
Smith & Nephew has certainly been a rather frustrating affair over recent months, both on a technical and a fundamental basis. This is something which is underlined on the daily chart where we see a very well entrenched trading range in place over the bulk of the past 18 months. All of this can be captured within a broadening triangle which can be drawn from as long ago as March last year. From a technical trading perspective the latest gap through the 50 day moving average at 1,129p would appear to be a significant event. In fact, even if it is not, while there is no end of day close back below the 50 day line one would be looking to progress towards the top of the triangle from last year as high as 1,240p over the next 4-6 weeks.
Small Caps Focus
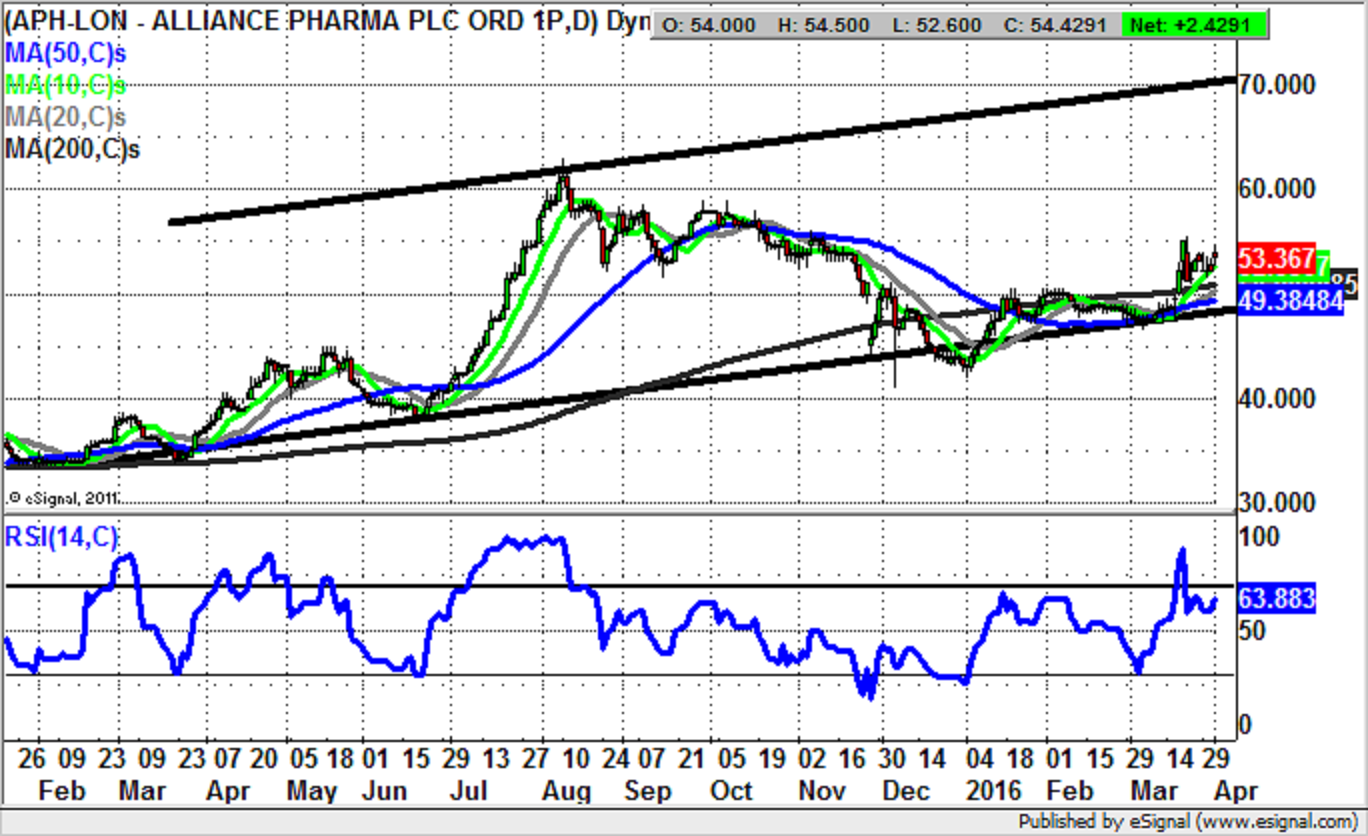
Alliance Pharma (APH): Rising Moving Averages Point towards 70p
While it may be admitted that Alliance Pharma shares are not the most dynamic in town, we have a situation where this is very much a stock to be followed on the basis that it remains something of a slow burn in favour of the bulls. What is helpful overall is the way that we can draw a rising trend channel on the daily chart from as long ago as February last year, based at the present level of the 50 day moving average at 49.38p. One would also be keen to point out the way that not only the 50 day line, but all the near-term moving averages are currently rising – something which is a decent witness to the overall positive momentum here. The past couple of weeks have seen the stock trade within a bull flag above the 200 day moving average at 50.92p. The assumption to make is that at least while above the 200 day line we would expect to see a progression as high as the one year rising trend channel at 70p. The timeframe on such a move is regarded as being the next 2-3 months.
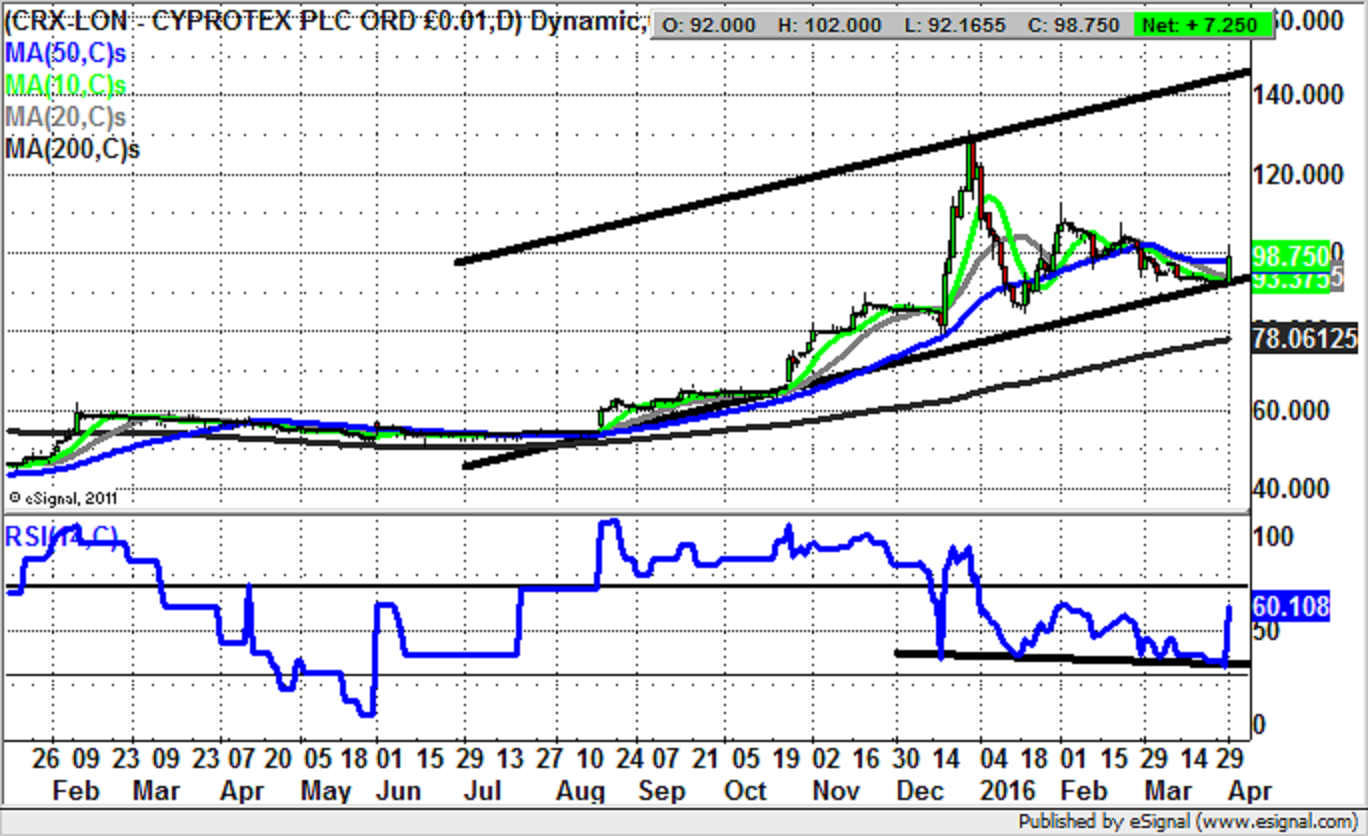
Cyprotex (CRX): Price Channel Target at 140p
There are a couple of major technical pointers here on the daily chart of Cyprotex in favour of the bulls. The first is the way that the 200 day moving average then at 55p was captured in February last year, and has supported the stock continuously ever since. The second is the overall rising trend channel from July last year with its floor well above the 200 day line which is now up to 78p. All of this goes to suggest that at least while there is no weekly close back below former 90p resistance at November the upside here should be considerable, even though the gains to date have already been significant. The technical target is as high as the 140p zone at the top of the 2015 price channel, with the timeframe on such a move being the next 2-3 months.
Comments (0)