Zak’s Daily Round-Up: HIK, RRS, RMG, FAM and OSU

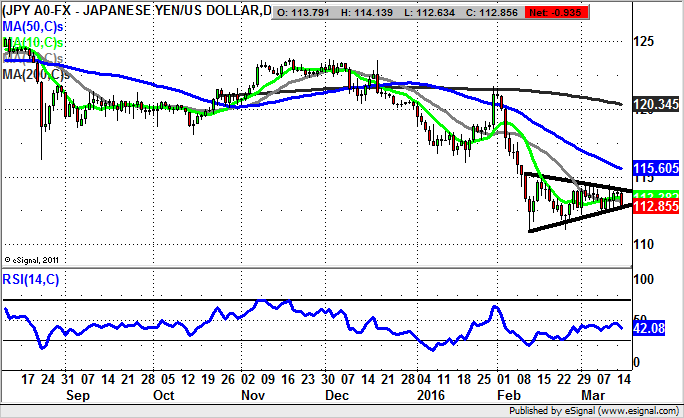
Market Direction: Dollar/Yen below 114 Could Lead Towards 106
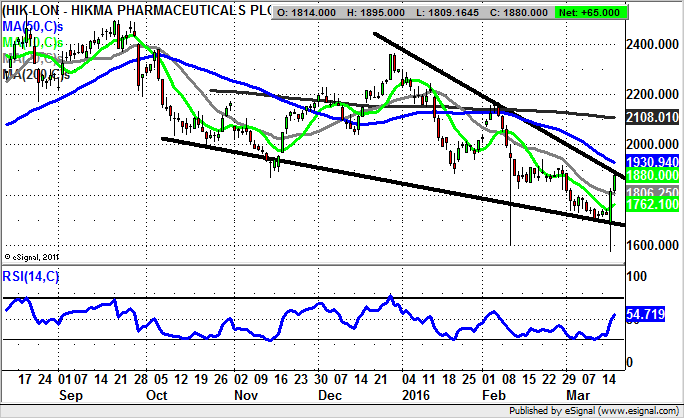
Hikma Pharma (HIK): Bear Trap Rebound Targets 200 Day Line
It has not exactly been a pleasant journey in the recent past for shares of Hikma Pharma, either on a technical or fundamental basis. This point is underlined with the problematic M&A the group has been involved in, as well as an eviction from the exclusive FTSE 100 club. The trials and tribulations are well illustrated on the daily chart of recent months, especially the rather horrific looking February price action, where one day alone delivered a range of 400p. In fact, this month has been pretty volatile as well, especially this week’s massive key reversal to the upside yesterday. The good thing about this big trading day though was the way it was also a narrow bear trap rebound from below the February year low. All of this goes to suggest that at least while there is no end of day close back below the 20 day moving average at 1,806p, we should be treated to at least an intermediate rally for Hikma. This would pencil in a target at the 50 day moving average at 1,930p over the next week, with a close above this then opening up the possibility of a 200 day moving average target at 2,108p over the following 2-4 weeks. However, given that theoretically while below the 200 day line this stock is in a charting sell trend, it might pay not to get too excited about this situation, even though it does appear there is plenty of buying interest here below 1,650p – judging by the long probing candles of this month and February.
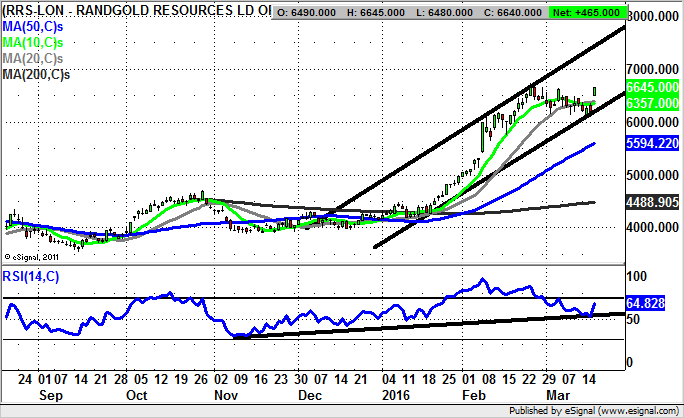
Randgold Resources (RRS): Rising Trend Channel Pointing To 8,000p
Although it would appear that over the recent past we have seen shares of Glencore (GLEN) and Anglo American (AAL) lead the charge in the great mining sector recovery, the stock which has arguably offered the smoothest ride has been Randgold Resources. This can be seen in the wake of that final bounce off the 50 day moving average then towards 4,200p in January, and the golden cross buy signal at the end of that month between the 50 day and 200 day moving averages. All of this occurred within a rising trend channel which has been in place since the beginning of December. What is also evident is the way that the latest leg to the upside was flagged by the uptrend line in the RSI window, which pre-empted the break higher with a rising trend from as long ago as November. What helps the current position here is that we are trading in the aftermath of a rebound off the floor of a rising December uptrend line, as well as a gap higher through the 10 day moving average at 6,357p. All of this would go to suggest that provided there is no end of day close back below the 10 day line, we should be treated to significantly higher prices here. The favoured destination at this point is as high as the three month resistance line projection currently pointing as high 8,000p. The time frame on such a move is as soon as the next 4-6 weeks.
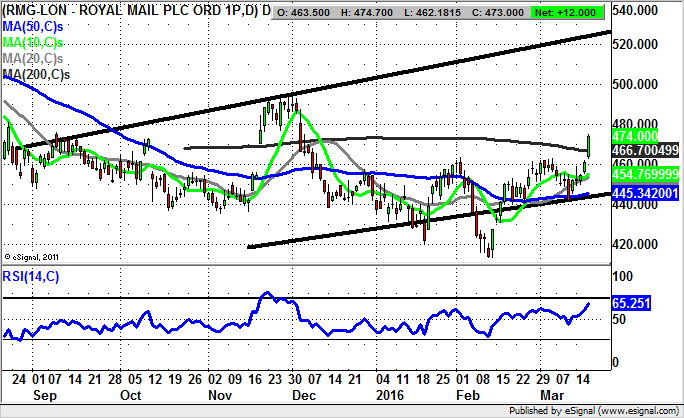
Royal Mail (RMG): Above Latest Gap Suggests 525p
It has been a while since I last looked at Royal Mail, and given that we are trading in the aftermath of a February bear trap gap reversal, one could argue that a month after that event we are looking to a confirmation of that bull signal. This comes in the form of a fresh gap to the upside, this time through the 200 day moving average at 466p. Given the way that technically speaking this is an event of relatively rare robust character, the view now is that we should be treated to an acceleration to the upside for Royal Mail shares. Indeed, the chances now are that provided there is no end of day close back below the gap floor at 461p, there should be decent upside. Just how high the stock could stretch over the next 4-6 weeks is suggested by the top of a rising trend channel drawn on the daily chart from as long ago as August at 525p. In the meantime, any dips towards the 200 day line at 466p can be regarded as a buying opportunity.
Small Caps Focus
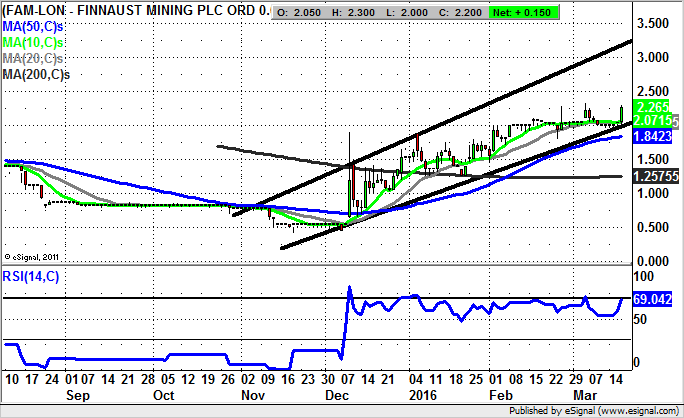
Finnaust Mining (FAM): 2015 Price Channel Target of 3.25p
As can be seen on the daily chart of Finnaust Mining over the recent past, it was perhaps December which really was the pivotal month for the shares, with the gap through the 50 day moving average at 0.6p that month. For March this initial recovery was backed by a double bounce off the 200 day moving average now at 1.25p. All of this occurred within a rising trend channel which can be drawn on the daily chart from as long ago as November. The position now is that even though we have already seen a significant gain since the start of the year, at least while there is no end of day close back below the 50 day moving average at 1.84p/the 2015 price channel floor, the upside here could be as great as the 2015 resistance line projection at 3.25p. The timeframe on such a move is the next 1-2 months.
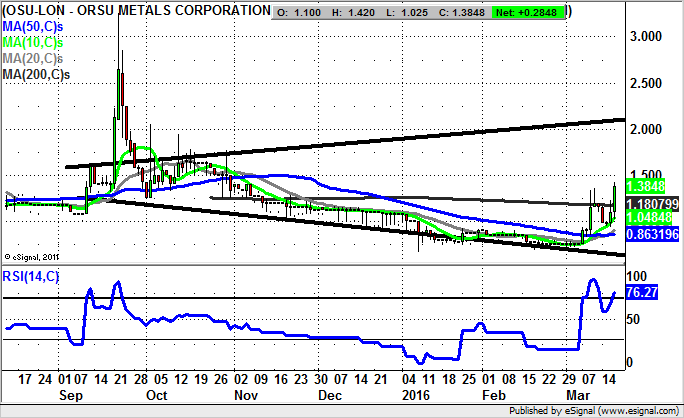
Orsu Metals (OSU): Broadening Triangle Targets 2p Plus
It is difficult for anyone of a bullish persuasion such as myself to resist looking at the daily chart of Orsu Metals in anything other than a positive way at the moment, given the charting configuration. This is said on the basis that the latest up day for the stock has created a V shaped bull flag either side of the 200 day moving average at 1.18p. The suggestion currently is that at least while there is no end of day close back below the 200 day line we could see a top of September broadening triangle target of 2p plus as soon as the end of next month.
Comments (0)