Zak’s Daily Round-Up: GKN, STAN, TUI, FPM, POS and RM2

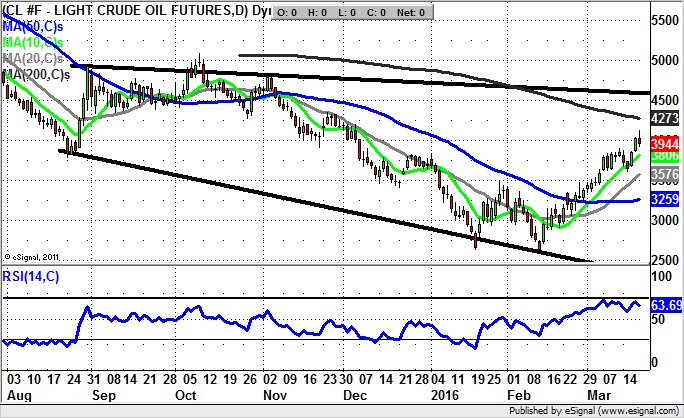
Market Direction: Crude Oil above $35 Targets $45
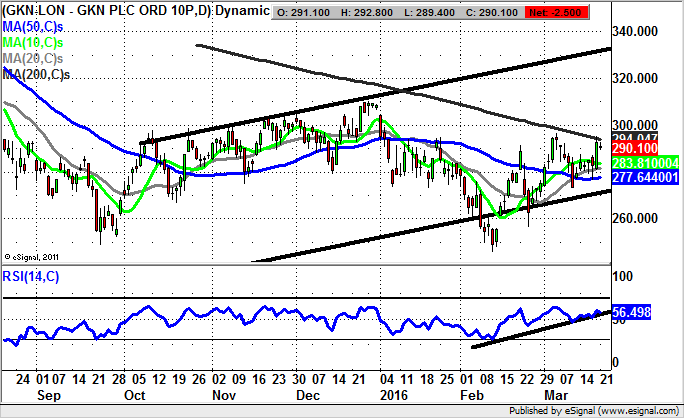
GKN (GKN): Gap Reversals Leads to 330p
It can be said of many stocks for February that they were displaying very strong reversal patterns, but of course the sentiment was so poor most of us would be wondering whether it was too risky to take the plunge on the upside when conditions were so bad. Nevertheless, it can be seen on the daily chart of GKN that there was a bear trap gap reversal from below the former September 248p intraday low. In fact, this reversal was so strong, even a subsequent sharp attempt to fill it last month failed to drill down to the 255.7p required. The position now is that we are looking at a March bear trap rebound from below the 50 day moving average at 277.4p. This would lead us to believe that while there is no end of day close back below the 50 day line we can look to a top of October price channel target as high as 330p over the next 4-6 weeks. Only cautious traders should wait on a clearance of the 200 day moving average at 294p before pressing the buy button.
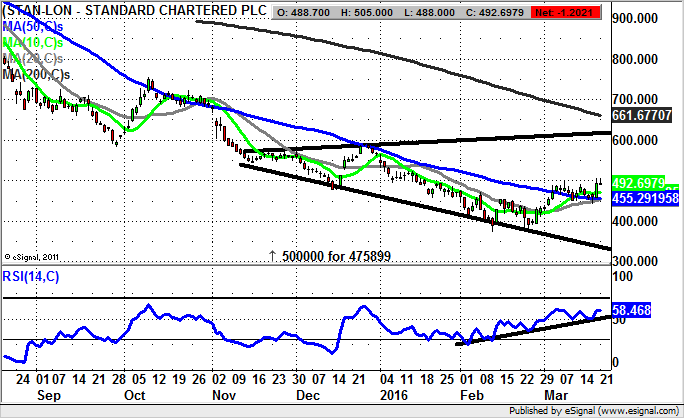
Standard Chartered (STAN): November Broadening Triangle Target
It is often the case that the 50 day line becomes the fast money technical line in the sand ahead of a lasting recovery for a stock or market. This is said despite the way it can be seen on the daily chart of Standard Chartered that there was a failed attempt to hold above this feature now at 455p, before a gap to the downside extended the bear run several months. However, for March to date we have been treated to an extended crawl either side of the 50 day line, with a decent weekly close just shy of 500p, after a day which has seen the price action almost wholly above the 50 day moving average. We are also helped in believing that Standard Chartered shares are capable of at least an intermediate rally by the way that there has been a multi tested uptrend line in the RSI window running at neutral 50 level. This should provide the momentum for a journey to the top of a November broadening triangle, one which is pointing to the 605p level. The technical target could be hit as soon as the next 6-8 weeks, meaning that long suffering bulls of this Far East focused bank could be in a rather better position by the end of next month.
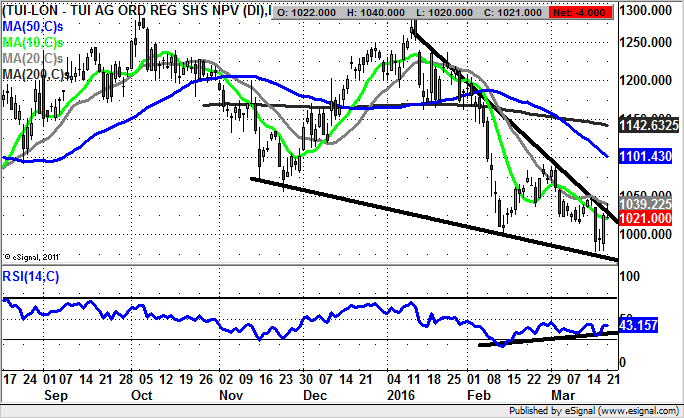
Tui (TUI): Wedge Reversal Points to 200 Day Line
Tui is not exactly known for being a traders’ stock, but it certainly is the case that at the moment we are looking at a situation which is in play technically speaking. This is said on the basis that we are looking at a possible reversal within a bullish falling wedge pattern which has been in place from as long ago as November. In fact, as far as the near-term set up is concerned, we are looking at a double buy signal in the sense that there is the rebound within the wedge backed by an uptrend line in the RSI window which has been in place since the middle of last month. Indeed, one can also add in the weekly close above the February 997p intraday low, a bear trap rebound. All that cautious traders might be waiting on now would be a clearance of the January resistance line / 20 day moving average at 1,041p. The target would then be the 200 day moving average now at 1,143p over the following 6- 8 weeks. At this stage only prolonged price action back below the recent triple tested support at 977p even begins to delay the recovery argument.
Small Caps Focus
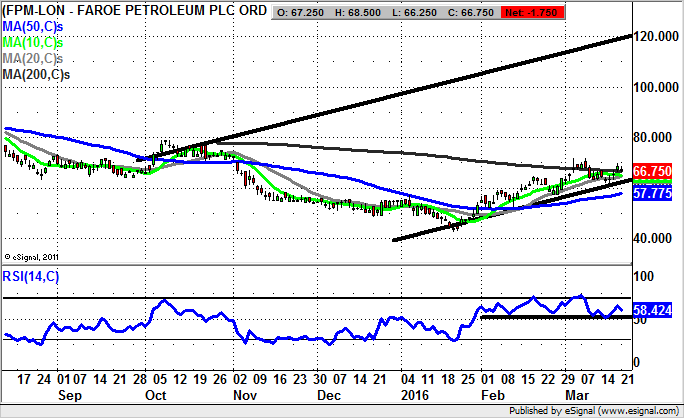
Faroe Petroleum (FPM): Price Channel Target as High as 120p
In some ways the significant recovery we have seen at Faroe Petroleum has been so simple and straightforward this has actually made the V shaped rebound difficult to get on the back of. The big breakthrough was reclamation of the 50 day moving average at 57.49p, above which the shares have remained ever since. The position now is that we have seen the stock hold above both the 50 day line and the floor of a rising trend channel which has been in place since from as long ago as October at its resistance line. That said, the view now is that provided there is no end of day close back below the uptrend line from the beginning of the year at 60p we are looking to significant upside. The top of last year’s price channel at 120p points to the 3-4 month target, especially if we get a relatively prompt break of the initial March resistance at 71.75p by the beginning of April.
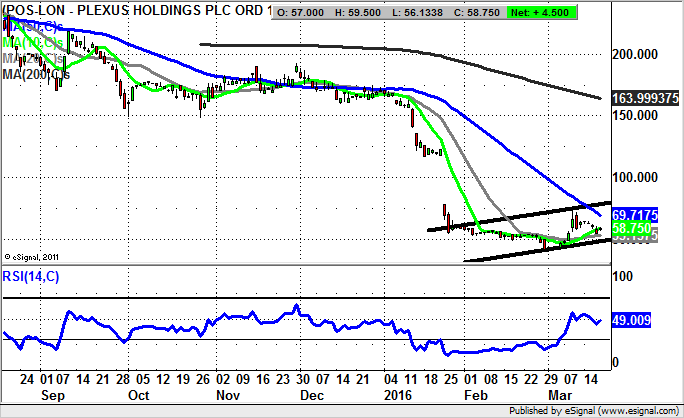
Plexus Holdings (POS): Key 20 Day Moving Average Support
Although it may be said that for much of the past few months we have Plexus Holdings doing a great impression of the Chart from Hell, the recovery of the 20 day moving average now at 53.13p has somewhat changed the picture to a more positive position. That said, the top of a rising trend channel at 80p and the floor of the January gap to the downside do appear to be the best on offer on the upside over the next 2-3 months, and this scenario could be snuffed out with as little as an end of day close back below the 20 day line. Therefore stop losses just below the 20 day line should be enforced quite strictly, especially since this is a stock which has a rather nasty habit of gapping to the downside.
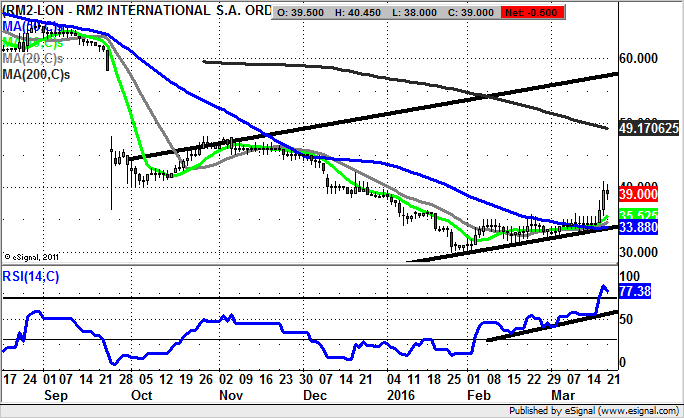
RM2 Holdings (RM2): Above 50 Day Line Targets 57p
I would venture to suggest that RM2 Holdings is one of the rare breed of UK stocks which I have not to this date charted. However, it would appear that the near-term setup here is a break of the 50 day moving average at 33.8p, an event which effectively ends the bear run for now. Indeed, while there is no end of day close back below the 50 day line we should be treated to an approach of the 200 day line at 49p over the next 4-6 weeks. After that the best case scenario is the top of a rising trend channel at 57p by mid 2016.
Comments (0)