Zak’s Daily Round-Up: BDEV, PFC, IRG and LGO

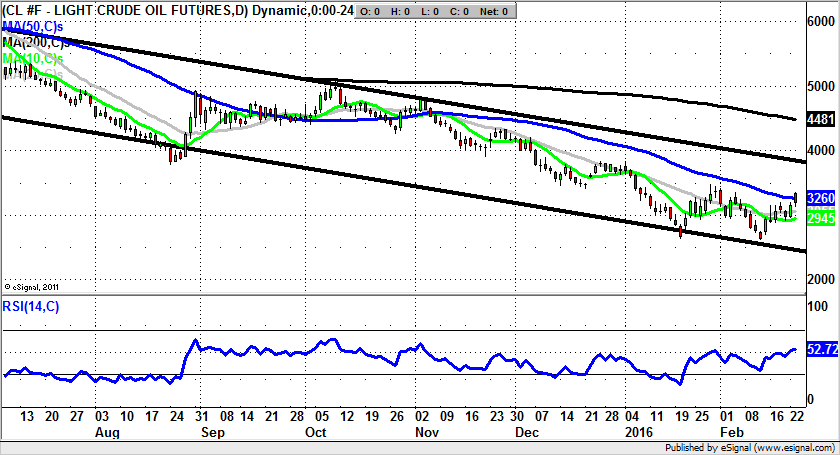
Market Position: WTI Crude Oil below £$35 Still Targets $25
Barratt Developments (BDEV): Key Support Zone towards 550p
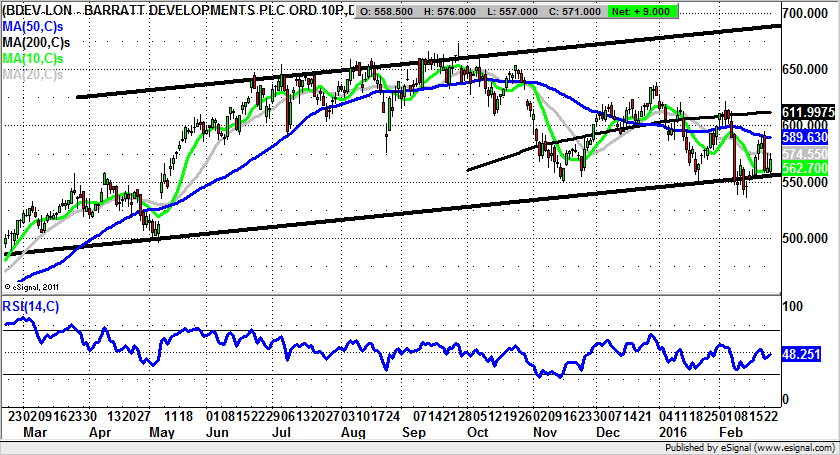
It is always interesting to see the explanation of a surprise sharp move to the downside, which in the case of the FTSE 100 today was “global growth fears”, or alternatively, “the market is down, and we don’t have a story.” But at least the “one way bet” otherwise known as the UK housing market continues unabated, on the basis of what we have heard today from Barratt Developments. The goods news has taken the form of a profits jump of 34.7%, similar to the one third rise for sector counterpart Persimmon (PSN) reported yesterday. The detail as far as Barratt Developments was concerned is that there was a strong first half with completions up over 9%, with operating margins up nearly 2%. This shows how current conditions with everything in favour of the seller continue to impact so positively on this company. As far as the big picture here is concerned it could be argued that the key point to note is the way annual output is up over 50% and that over the past five years over 70,000 new homes have been built. This shows how much effort housebuilders are putting into making up the deficit between the 250,000 migrants a year looking for accommodation – a thankless, but very profitable task. As far as what can be seen on the daily chart of Barratt’s, we are looking at a bull scenario in terms of the overall uptrend, but perhaps ironically not a situation which has been the runaway move to the upside one might have expected. The key here will be whether the main one year uptrend line at 557p is held on an end of day close basis. The proximity of this level provides us with a decent risk/reward zone to trade against, with the message being that while above it one would be looking for a rebound back towards the 200 day moving average at 611p. But after the post summer breakdown for this market only a weekly close back above this feature would really suggest that Barratt Developments is back in prime bull mode.
Petrofac (PFC): An Unlikely Upside Candidate
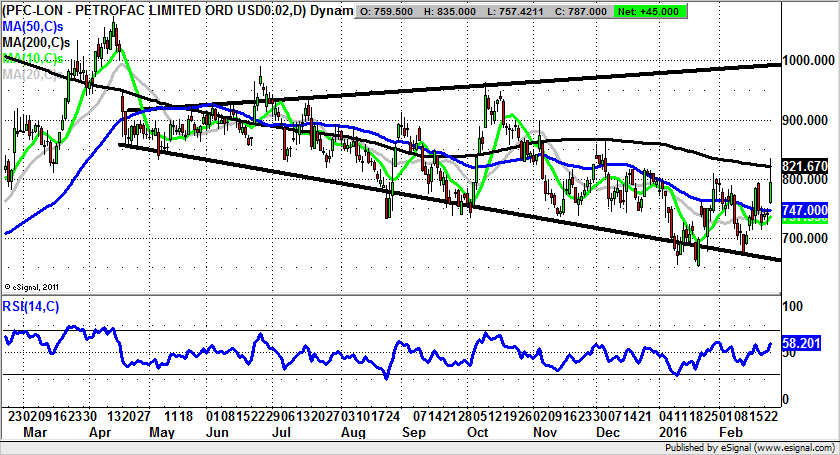
On the face of it Petrofac does not seem to be the stock of the moment, given that the group is an oil services company operating in the aftermath of a decline in the sector which is unprecedented in terms of the severity of the pain since the 1980s. Indeed, it could be argued that the Crude Oil price decline of 1986 was a great leading indicator on the stock market crash of 1987. This as well as the way that the stock market has a nasty habit of crashing around the end of two-term U.S. Presidencies. Given that President Obama has done less than most in recent history on any front, a possible crash this year would not be surprising, and may of course actually be underway as we speak. Ironically, as far as what Petrofac has had to say with regard to earnings, the profits decline by two thirds from 2014 to 2015 was perhaps not as bad as might have been feared. This is given the way that the key North Sea project the company is involved with is set against a backdrop of an area which is struggling to keep the lights on at $30 – considering its breakeven is close to $60 or more a barrel. However, the daily chart is in what could be described as bumping along the bottom mode, with the higher support for 2016 to date versus 2015 quite a consoling aspect. Indeed, what one would say now is that while there is no end of day close back below the latest chart gap at 750p, we should give the benefit of the doubt to the upside argument. This has already served up a spike towards the 200 day moving average at 821p, with the hope being that a weekly close above this feature could lead back to the top of a 1,000p one-year broadening triangle target – 1-2 months after the 200 day line is breached.
Small Caps Focus
Independent Resources (IRG): Triangle Reversal to 0.35p
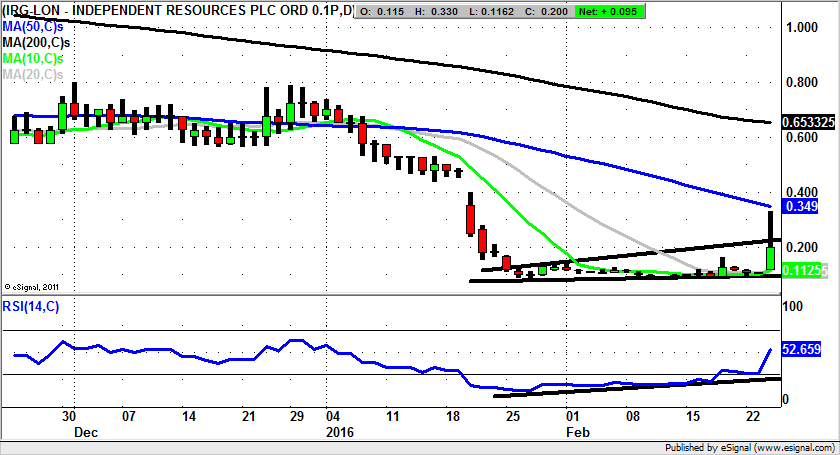
One of my New Year’s resolutions has been to attempt to switch as much as possible from momentum situations, where one is just hoping a trend will continue, to the reversal play, something which one would hope could be much more useful to investors. This is especially the case in beaten up situations such as Independent Resources. The “trick” here was to try to identify the trajectory of the stock once the base was made. The possibility of a break to the upside such as the 100% spike at best today was suggested by the rising trendline in the RSI window. The oscillator is usually a decent leading indicator on upside, and this has proved to be the case on this occasion. Perhaps the best assumption to make now is that an end of day close above the top of the January triangle at 0.22p could lead back to the 50 day moving average at 0.34p over the next couple of weeks.
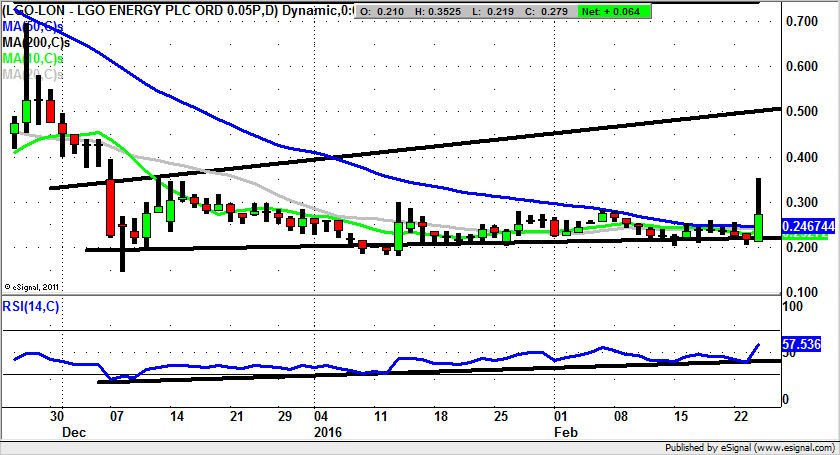
LGO Energy (LGO): Possible Triangle Reversal towards 1p
What is interesting about the daily chart configuration of LGO Energy over the recent past has been the way that we have been treated to an uptrend line in the RSI window, which suggests that there was positive divergence which could lead to a turnaround. Unfortunately, until today’s funding news it was difficult to divine what the trigger for a turnaround could be. But at least now the cat is out of the bag we have a potential recovery situation, with a possible technical price target in place. This comes in the form of the chance of a journey to a December resistance line projection at 0.5p – a 2-3 months target. Only back below 0.2p support on a weekly close would currently scupper such an idea.
Comments (0)