The secret to sweet success when trading Tate & Lyle

Tate & Lyle (TATE), for those who didn’t know, is no longer in the business of making Britain the fattest, even if it is also possibly the phattest, country in Europe. They got out of the sugar business some years ago in 2010 when they sold the Tate & Lyle sugar brand and Golden Lion syrup. It’s highly confusing when ongoing brands sell part of their brand. Rolls-Royce (RR.) sold their car division but still make Rolls-Royce engines for planes, for example.
T&L is a curious chart from a TA perspective. There are lots of gaps down followed by temporary recovery, then another gap down. There’s been one already this year. What does it all mean? Well it means for one thing that oscillators (e.g. stochastics) and averages are all over the place. For that matter, how can you trade variance on a moving average when massive variance appears overnight?
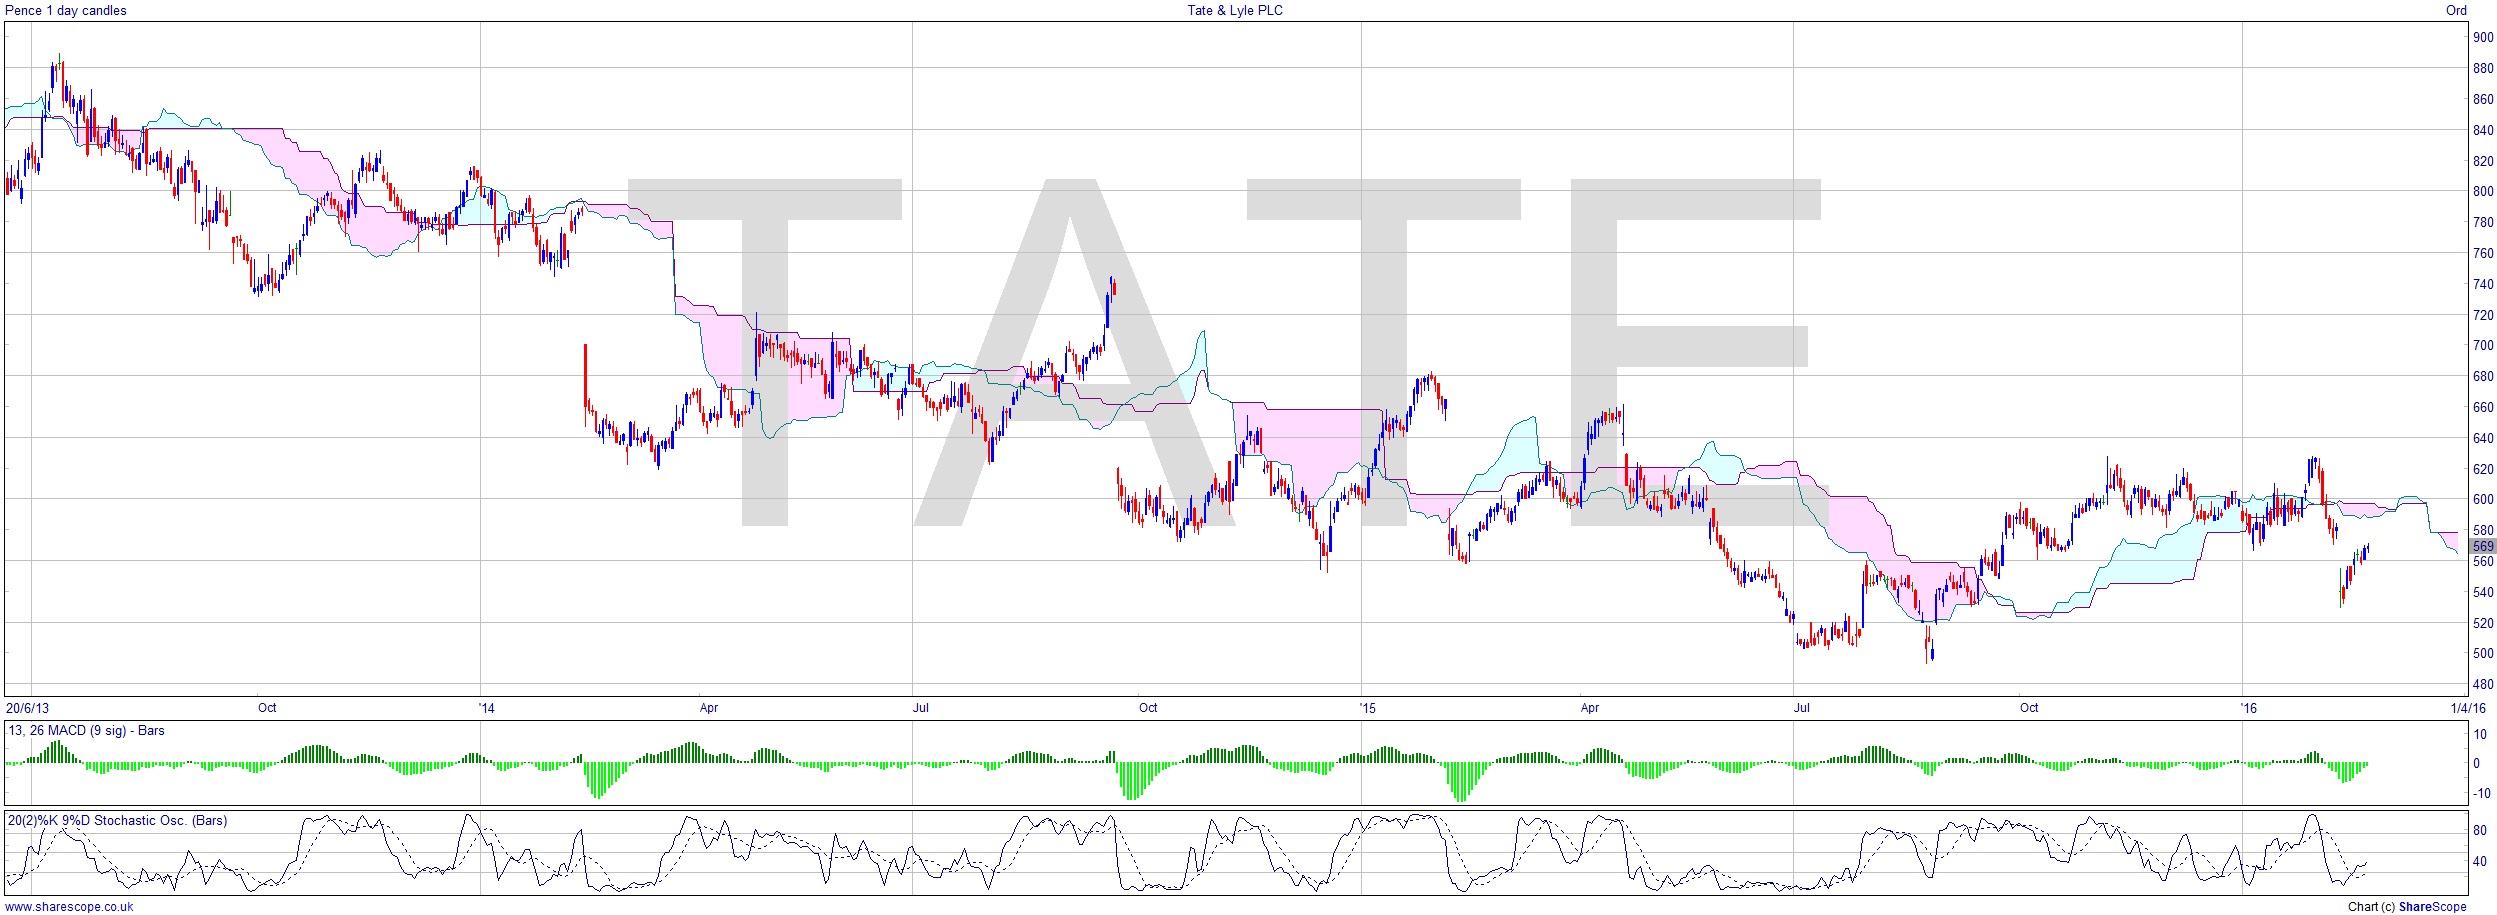
Certainly this is a stock where you’d want a trailing stop and a guaranteed one at that. Overall the stock looks like it could be bottoming out.
This is a classic occasion when the Point & Figure chart is helpful. Although one shortfall with the P+F is that it fills in those gaps, but it is excellent at picking out long-term patterns and also support and resistance. Whereas the candlestick chart is fairly unhelpful, as are our Technical Indicators, we can see much more useful info at a glance on the P+F.
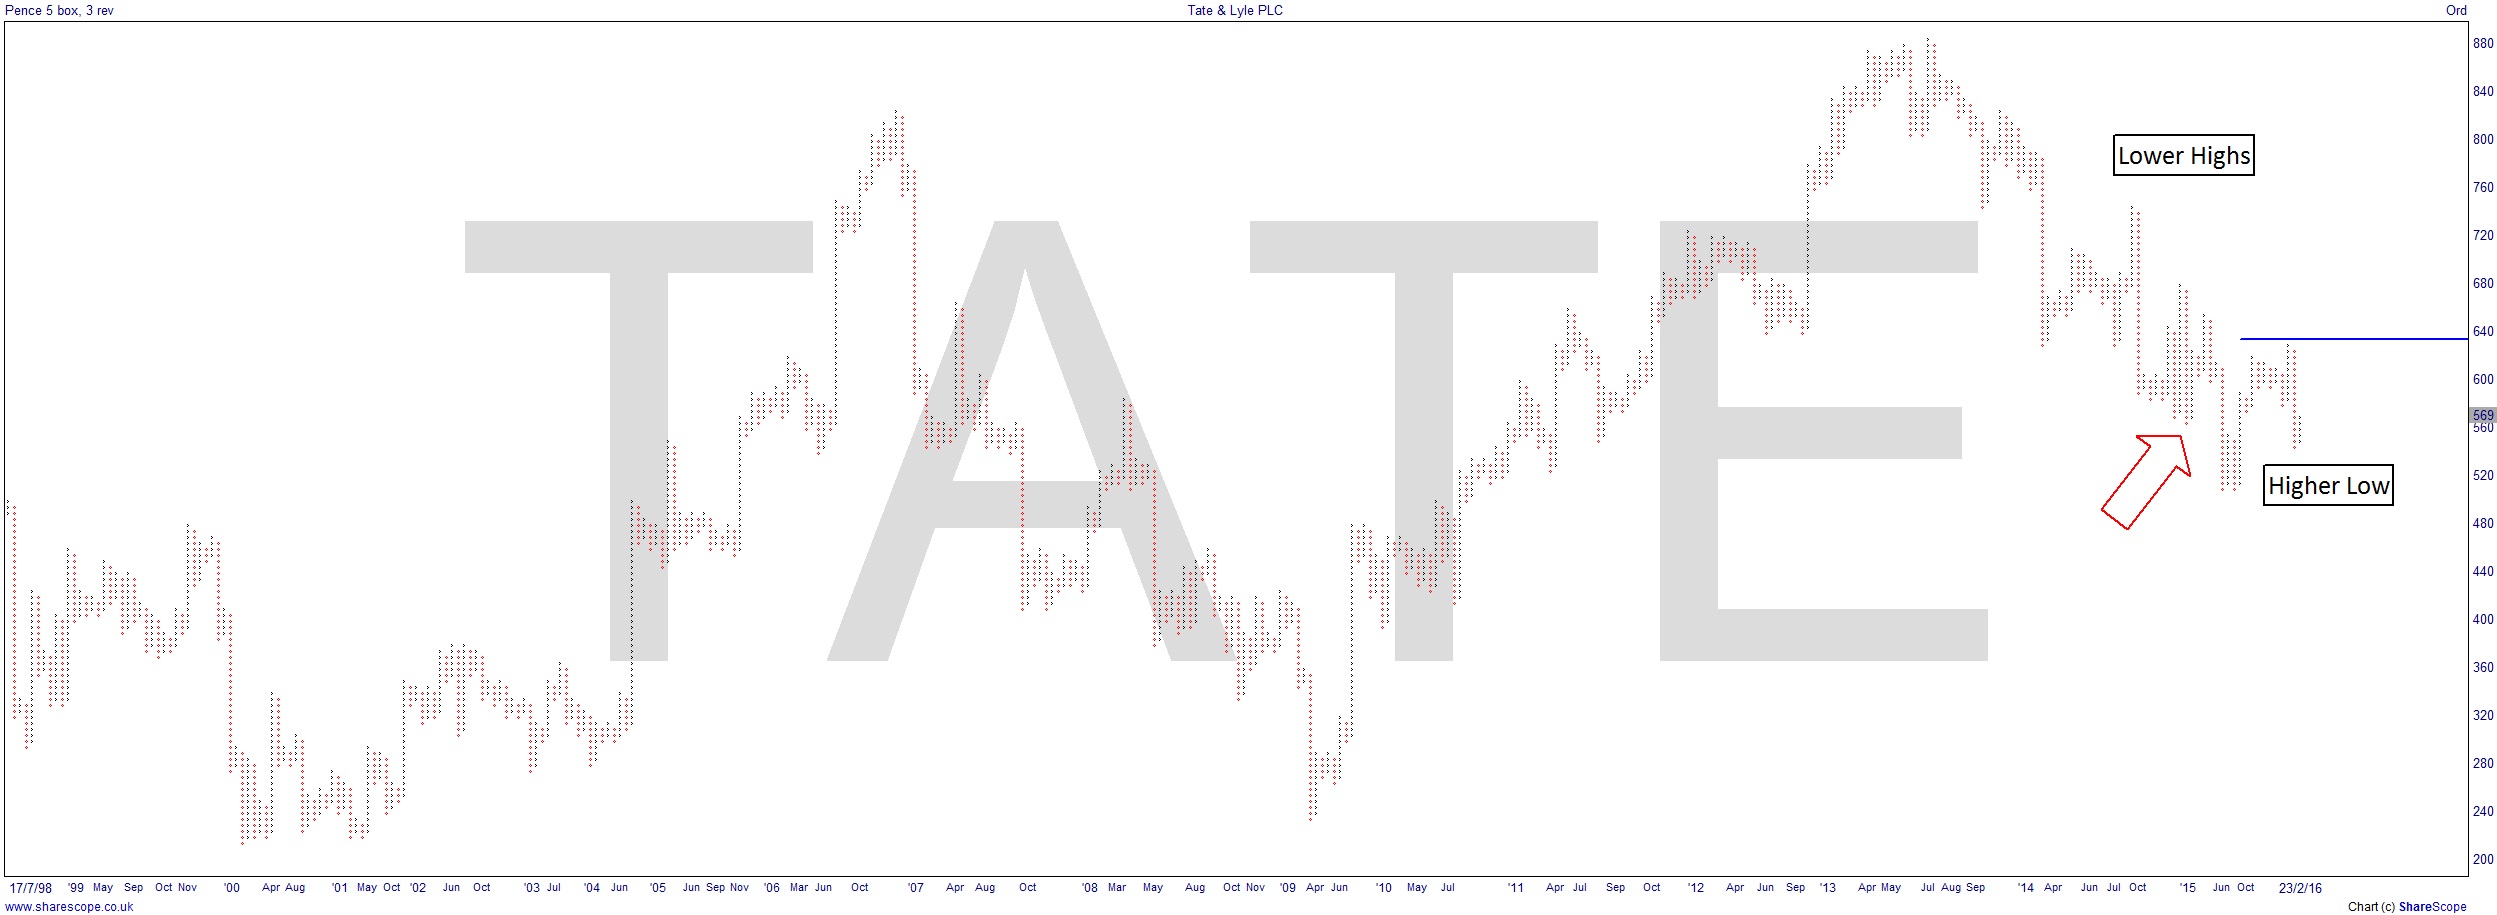
First off, there is quite a clear downward trend. Note also that this is a window the same size as the candlestick image, yet shows the P+F back to ’98, whereas the candlestick only goes back to 2013. P+F charts are not controlled by time frames, so there is no ‘weekly’ chart for example. It relies on a function of the number of price units. In order to see a change in trend we are certainly going to need to see a Higher Low. Dow Theory applies equally to bar charts as to P+F.
We see that Higher Low has possibly just happened, although the price could turn tail and take that low out, in which case it’s back to the drawing board. But if it goes on up above that blue resistance level, and particularly if it made another Higher Low at or above the level of the low I’ve marked with a big fat red arrow, then we could be looking at a nice rally.
The key to trading this stock is really to manage your stops very tightly. They’re still in basic food stuffs and presumably the demand is fairly constant, even if the global weather isn’t.
Comments (0)