Zak’s Daily Round-Up: BA., JMAT, GWMO, GRPH and OEX

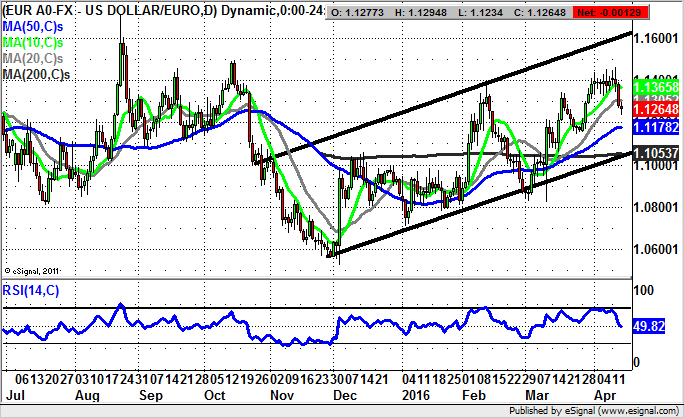
Market Direction: Euro/Dollar below 10 Day Line Risks $1.11
BAE Systems (BA.): 575p Technical Target
I have to admit that I am still trying to work out why shares of BAE Systems remain amongst the most viewed in terms of investors seeking out its stock price? However, it is a FTSE 100 stock and given that we are in amongst the worst geopolitical times ever, it is understandable that those seeking to profit from the hell on earth that we appear to be intent on creating would want to invest in this company.
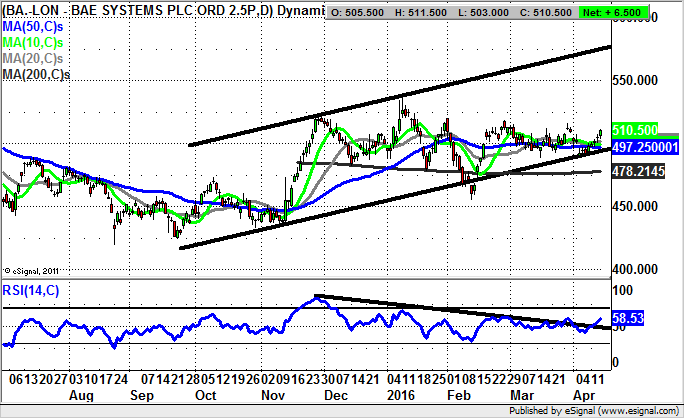
As far as the daily chart configuration is concerned it can be seen that there has been progress within a rising trend channel which can be drawn from as long ago as September last year. The floor of the channel currently runs level with the 50 day moving average at 497p, with the message being that while there is no end of day close back below this feature we should be treated to further significant upside. This is especially the case given the way that as recently as February we were on the receiving end of a quite special two-day island reversal bear trap from below the 200 day moving average at 478p.
Therefore the prospect of a target as high as the top of last year’s trend channel at 575p appears highly likely over the next 1 to 2 months, especially if we can see a quick break above last month’s 520p zone resistance over the next week or so. At this stage only well back below the 200 day line would in fact even begin to suggest that the recent consolidation for the shares was about to be ended with a negative outcome.
Johnson Matthey (JMAT): Price Channel Points to 3,200p
Johnson Matthey is the type of stock for which I have long harboured the notion of an imminent takeover bid from an international conglomerate. However, I have grown old waiting for this scenario to occur, a concept compounded in terms of its unlikely reality by the way that it would appear these days so few blue chips have a straightforward M&A process. The advent of the concept of tax inversion has also not helped.
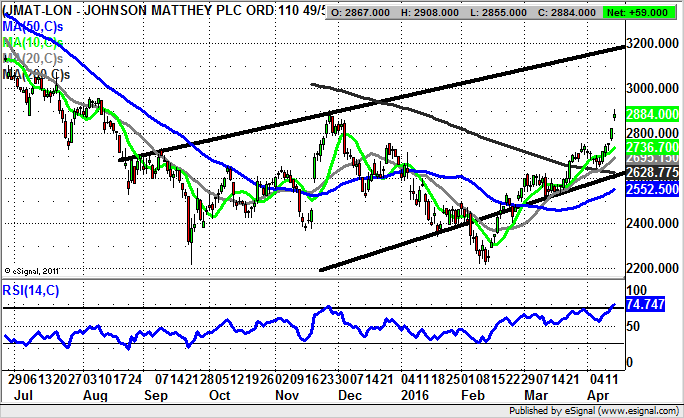
Therefore it seems safest to simply look at the daily chart configuration of the catalytic converter group where we see how one can draw a rising trend channel from as long ago as August last year. Conveniently, the floor of the channel runs level with the 200 day moving average currently at 2,628p, with the implication being that providing there is no weekly close back below this notional double support, there could still be considerable upside over and above what we have seen since early February.
The favoured destination at this stage is the 2015 resistance live projection at 3,200p, a zone which could be hit as soon as the end of next month. This is particularly the case after the latest double gaps to the upside, with the ideal scenario being that there is no break back below the former March resistance at 2,756p, before our favoured price action outcome is delivered. In the meantime any dips towards the resistance of last month to cool off the overbought RSI indicator at 73/100 would be welcome if only to improve the risk reward ratio of going long.
Small Caps Focus
Great Western Mining (GWMO): 0.8p on Tap after Extended Base
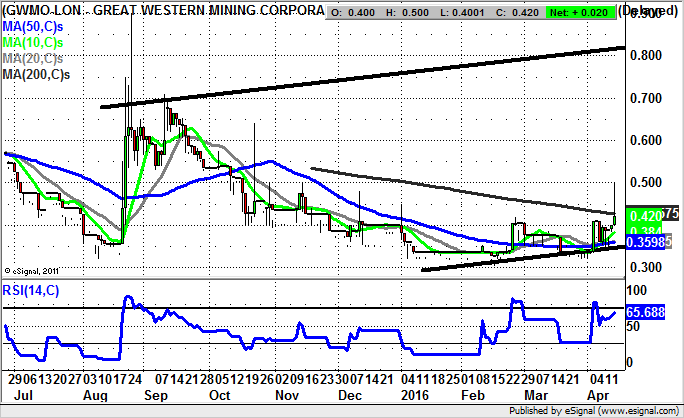
While we have to acknowledge the way that Great Western Mining shares have taken rather longer to deliver the goods either on the fundamental or the technical front, the latest setup over the past couple of months in which there has been decent base building does draw our attention once again to this situation as a recovery play.
The favoured scenario now is that we will see a weekly close back above the 200 day moving average at 0.45p either this week or next, and this should be the trigger for a decent move to the upside. The favoured destination at this point is the top of a rising trend channel which has been in place since as long ago as August last year. It has its resistance line projection heading as high as 0.8p, which would nearly double the share price from current levels. Perhaps the best thing about the whole charting configuration here is that it is a reasonably attractive prospect on a risk reward basis given the way that the notional stop loss is a weekly close back below the 50 day moving average at 0.35p.
Graphene Nanochem (GRPH): Broadening Triangle through 25p
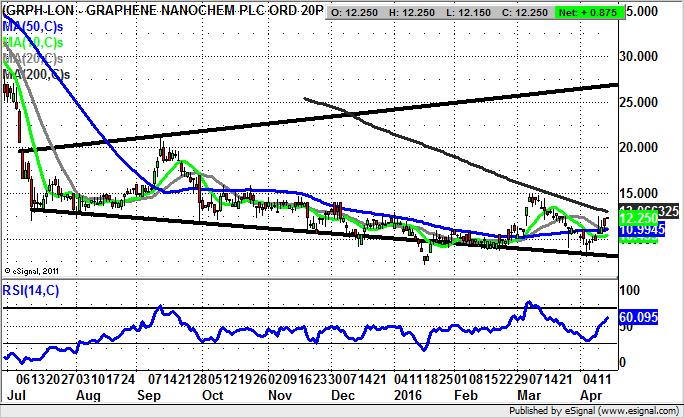
Graphene Nanochem is at least one of those types of small cap situations which should inspire private investors on the long side. This is especially the case given what appears to be key new economy plus points. However, it can be seen on the daily chart that in recent months there has not exactly been a stampede in favour of the longs. But it may be the case nevertheless that if we see a weekly close above the 200 day moving average, currently at 13.06p, over the next couple of weeks, this would make for a decent turnaround play.
The favoured destination as things stand would be the top of a broadening triangle which has been in place on the daily chart from as long ago as July. While this admittedly appears to be quite a long way away, given the bumping along the bottom action we have seen and the basing out for so long, one should not underestimate the prospect of decent upside over the next 2 to 3 months.
Oilex (OEX): Above 50 Day Line Points As High As 2p
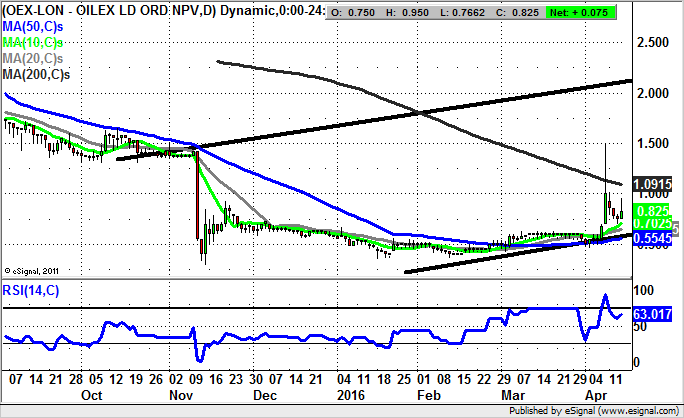
What is evident on the daily chart of Oilex is the way that the shares have been basing out for a considerable period of time. However, while it might appear to be on the early side as far as getting back in on the long tack, the extended consolidation by the shares at and above the 50 day moving average at 0.55p does give considerable grounds for optimism. Indeed, as little as a weekly close back above the 20 day moving average at 1.09p should be enough to take this stock back up to the top of last year’s trend channel at 2p plus over the following 2 to 3 months.
Comments (0)