Zak’s Daily Round-Up: BA., CNA, AMER and ROSE

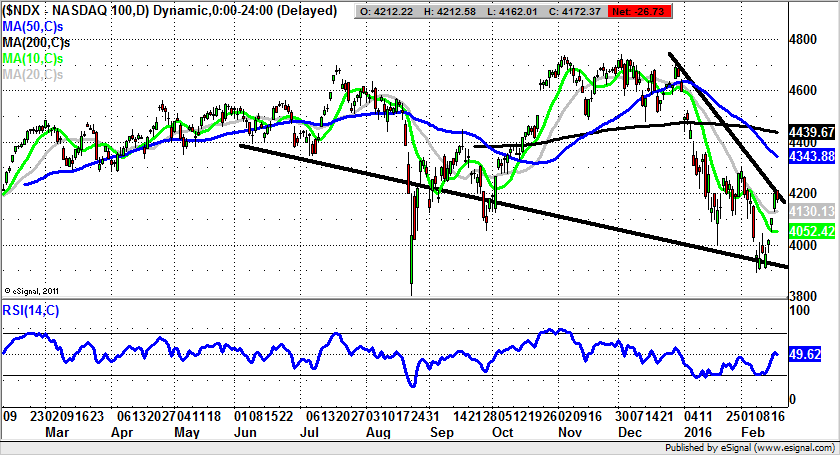
Market Position: Nasdaq 100 Above 4,050 Targets 4,350
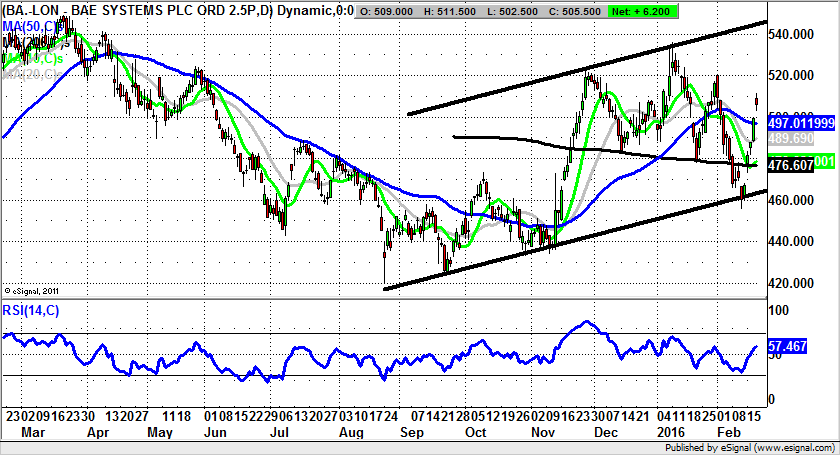
BAE Systems (BA.): 200 Day Line Gap Reversal Targets 540p Initially
It would appear that bad times are good times for the aerospace & defence industry. What has also been interesting is the way that private investors have been glued to the movements of BAE stock, if the analysis on a certain leading stockbroker’s website is anything to go by. This is quite intriguing given the way that the average punter is normally mesmerised by sectors they know, or think they know, such as supermarkets and banks. In the case of BAE Systems though, it could be that the £36.8bn orders pipeline and the possibility of World War III kicking off at any time have sharpened the focus on this situation. It is worth noting that, for instance, yesterday there were reports of Russian jet fighters flying close to UK airspace. While this may just be an attempt by the Putin regime to fluff up the price of Crude Oil, it is also great marketing for BAE Systems. What is evident on the daily chart of the stock is the way that we are seeing the shares behave in quite a technical fashion. This is because the February support at 455p was effectively a rebound off the floor of a November gap to the upside at 466p. The 11p overshoot was underlined by the February gap to the downside, and then upside creating a very powerful island reversal formation last week. This correctly forecast the latest bear trap rebound from below the 200 day moving average at 476p. The view at this stage is that provided there is no end of day close back below the 50 day moving average and the latest gap at 497p, we can assume further recovery here. The favoured destination is the top of a rising trend channel in place from as long ago as August over the next 3-4 weeks. The RSI at 58 suggests that even after the recent 10% recovery the shares are well off being overbought in a conventional sense.
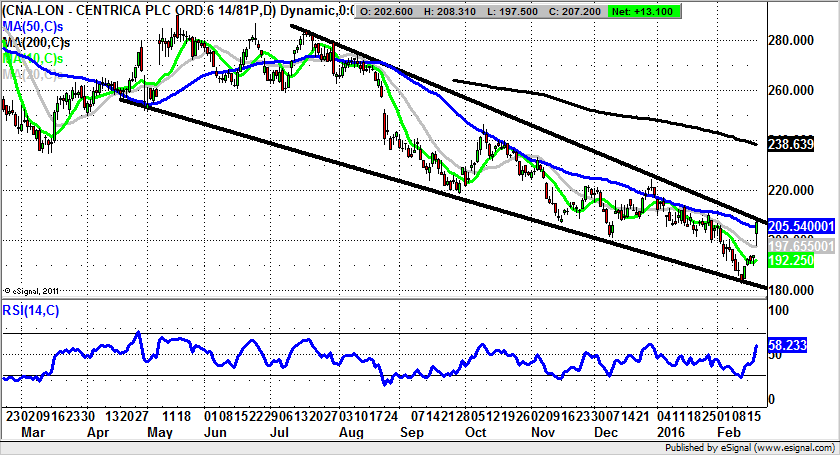
Centrica (CNA): Bear Trap below 200p to Lead to 200 Day Line
I have to say that I really enjoyed the CEO of Centrica, the owner of British Gas, squirming like a toad on Radio 4’s Today programme. The main problem he had was having to explain the way that even though energy costs on the gas front have tanked over the past year and a half, the unsuspecting Great British public has had to make do with just a 10% decline in their bills. All sorts of management spin techniques were employed by Ian Conn, including “that is a good question”, and “I am glad you asked that”; but of course what the leader of this former state backed money-losing utility could not say explicitly was that there was a cock up on both hedging higher prices and a hit from the production side, which presumably the retail customer has to cover first, before they are allowed to get the benefit of the hydrocarbon meltdown we have experienced. This is even though the fall in full year profits and revenues has led to that horror of horrors, a dividend cut. So it is not only the little person in the street suffering, but also the shareholder. Looking at the technical position of Centrica, it can be seen how the gap to the upside today suggests that there has been an element of surprise in terms of the latest update from the group, the trimming of the dividend notwithstanding. What can be said now is that one would be looking to an end of day close today back above the former December 200p support, leading to a significant new leg to the upside within the overall falling wedge reversal formation in place since July. Indeed, the logical initial upside over the next 4-6 weeks would be towards the 200 day moving average now at 238p – the area of former October support. The stop loss on the recovery argument would be back below the overnight gap at 197p.
Small Caps Focus
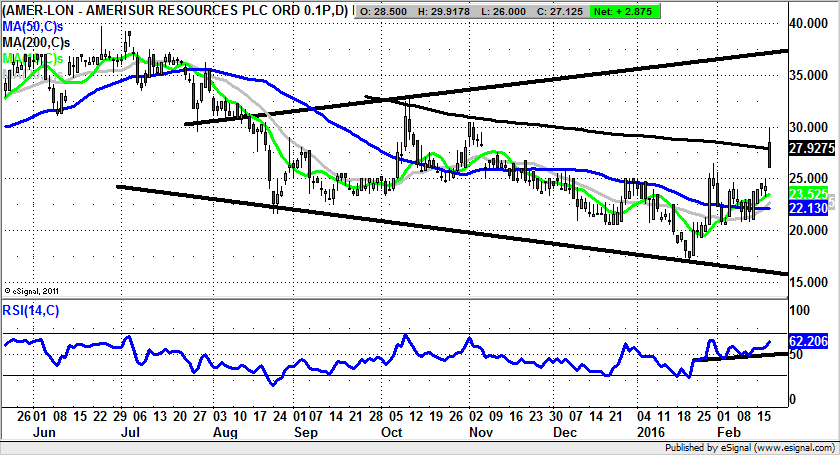
Amerisur (AMER): Triangle Target at 37p
The last time I was informed regarding the long awaited key pipeline which would significantly reduce the production costs of South America focused oil & gas producer Amerisur, we were still waiting on an imminent green flag for the transformational event. As far as I can ascertain, this event has been imminent since last summer, which, combined with the pain associated with the oil price decline, means we have been waiting quite a while for fundamental salvation here. Looking at the daily chart of Amerisur it can be seen how there has been a broadening triangle in place since as long ago as August, with the floor of the formation’s support line projection pointing as low as 15p. However, it would appear that in the wake of the brief January bear trap rebound from below 20p, the stock has mapped out a floor in the near term. Therefore, the assumption to make now is that provided there is no end of day close back below the latest gap to the upside at 25p, we should be treated to decent progress higher. The favoured destination at this point is seen as being as high as the top of the August triangle at 37p over the next 1-2 months.
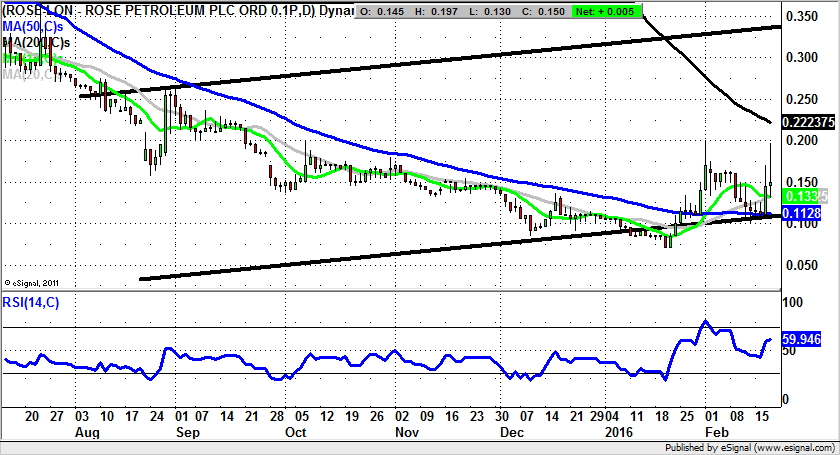
Rose Petroleum (ROSE): Above the 50 Day Line Could Lead to 0.35p Plus
As can be seen from the recent price history on the daily chart of Rose Petroleum, this has been a stock to shy away from, with the only real redeeming factor over the recent past being the way that the 50 day moving average now at 0.11p has been recovered. However, this may be significant in the sense that we have seen support come in above this feature, with the higher support for February appearing to be a significant charting breakthrough for the bulls. The likelihood now is that provided there is no end of day close back below the 50 day line, we may be due for an initial journey back towards the 200 day moving average at 0.22p. A weekly close above this feature could lead as high as former July resistance at 0.35p plus over the following 1-2 months.
Comments (0)