Zak’s Daily Round-Up: AGK, PSN, FXPO, OEX and XEL

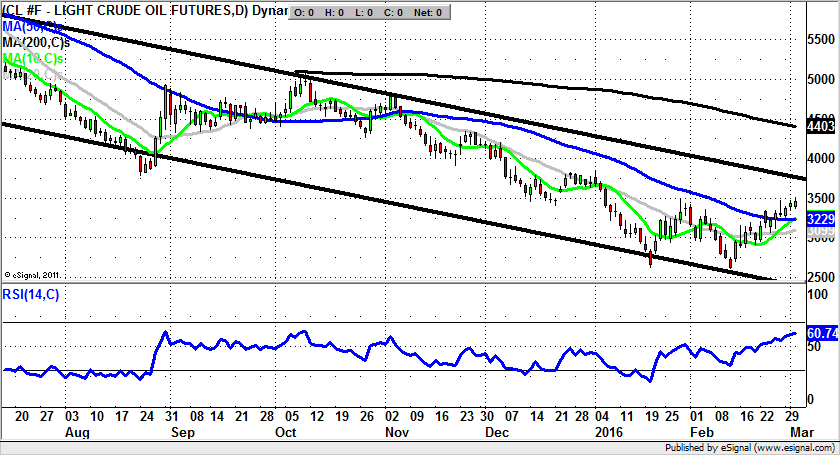
Market Position: Front Month WTI – $35 Still Key Resistance
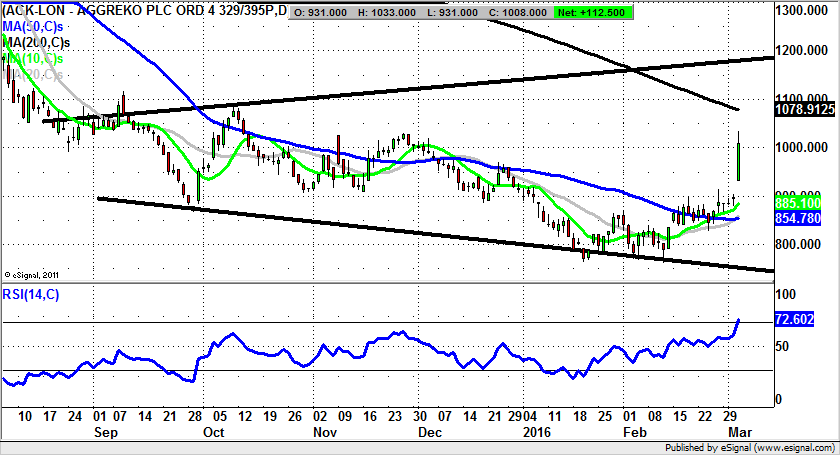
Aggreko (AGK): Gap through 50 Day Line towards 1,200p
It really has been a long process of recovery in the recent history of Aggreko. But after many months of rehabilitation it can be seen how the bulls look to be on the front foot again. This is said in the wake of the latest gap to the upside through the late December resistance at 970p. Given the way that the stock is currently just above the 1,000p level, we have a decent risk/reward trade for those who believe that the worst is over. This would especially be the case while there is no end of day close back below the last December peak. In fact, given the way that the RSI is currently at 72 and overbought, technical traders may actually welcome an initial dip to buy down towards the sub 1,000p area.
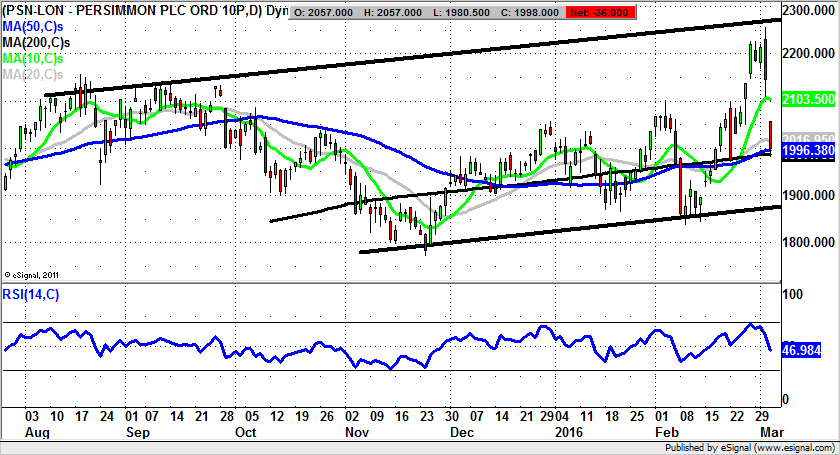
Persimmon (PSN): Price Channel Top Rejection
While it is almost impossible to find anyone bearish on the housing market that has not always been a bear, what can be seen on the daily chart of Persimmon is that we appear to be operating at a rather febrile time, with sentiment starting to swing around. This point is underlined by the sharp gap down from the top of a rising trend channel on the daily chart of the builder. The risk now is that even though we are now way off the top of the range, as little as an end of day close back below the 200 day moving average at 1,987p, there will be a more full blooded decline back to the 2015 price channel floor at 1,880p over the next 4-6 weeks. Indeed, those already short of the stock would use the bottom of the latest gap at 2,057p as their end of day close stop loss to trail the position to the downside. It would certainly be something of a warning if the shares topped out when the fundamentals are allegedly still so strong.
Small Caps Focus
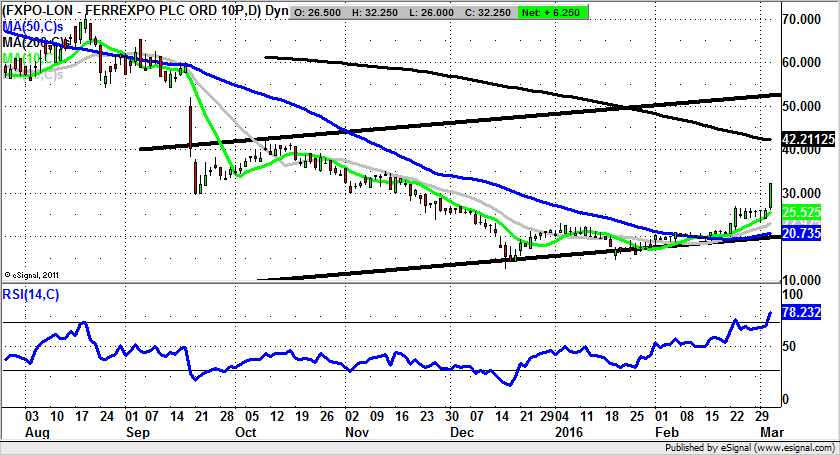
Ferrexpo (FXPO): Bull Flag Suggests 50p Plus
I have to admit that I was rather chuffed that the bullish call on Lonmin on Wednesday led to an initial 25% spike for the stock early the next day. This may have of course been a coincidence, but it was actually a Twitter follower who reminded me that he spotted the shares as a long opportunity at 38p, which rather put everything into perspective. However, it is still the case that the key here is really that charting can work in a very accurate way, not so much that it can be the brains of a talented trader. As far as what may happen next is concerned, it can be seen that shares of Ferrexpo are trading in the aftermath of a bull flag breakout, above the former February resistance at 27p. The assumption to make is that provided there is no end of day close back below the old peak of last month, the upside here could be as great as the September price channel top at 50p plus, as soon as the end of March.
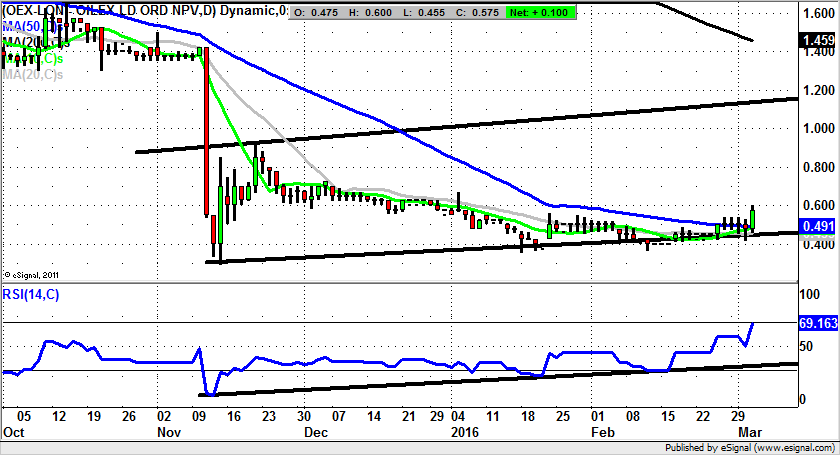
Oilex (OEX): 1.2p November Price Channel Top
Although the recovery at Oilex on its daily chart may not yet appear to be much, the story for 2016 to date at many small cap commodities and energy plays is of similar extended bases leading to decent upside moves. In this instance the expectation is for progress within a rising trend channel, one which can be drawn from as long ago as the beginning of November. The floor of the channel currently runs level with the 50 day moving average at 0.49p, with the big plus being the way that this feature has been cleared on an end of day close basis. The implication is that provided here is no end of day close back below the autumn price channel floor at 0.4p, we could be looking to a top of late 2015 resistance line projection target up at 1.2p. This is expected to be hit as soon as the next 1-2 months.
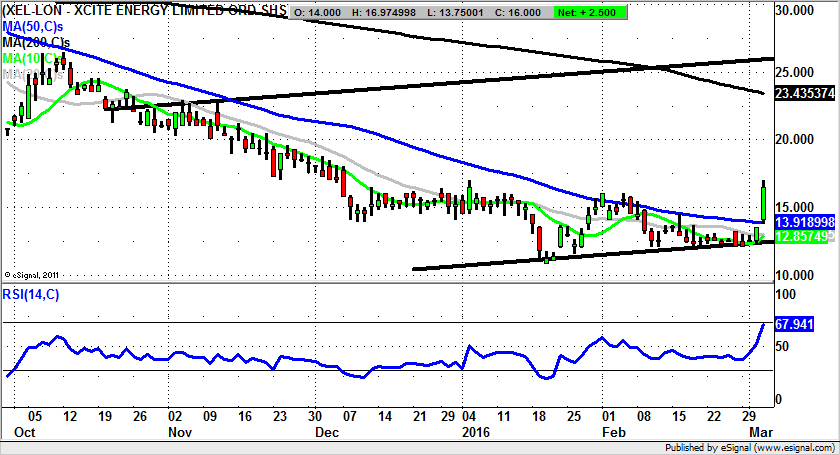
Xcite Energy (XEL): 25p Technical Target
In light of the recent newsflow that seems to suggest the North Sea is on its last legs, the latest revival in the share price of Xcite Energy is something of a surprise, albeit a welcome one. This is because under $40 a barrel it is likely that the whole of this area of exploration is almost certainly literally underwater as far as costs are concerned. Considering the way that the owner of the last big significant resource in the Bentley Field was seeing its share price on the back foot at much higher levels when the price of the underlying commodity was over $100, it is probably the case that most traders would have given up the ghost as far as the bull/recovery argument was concerned here quite some time ago. However, as is often the case, just when one gives up the ghost on a stock or market, this capitulation can very often mark the floor. Indeed, it has been something we saw only recently as far as the mining sector was concerned, with Anglo American (AAL), Glencore (GLEN) and Lonmin (LMI) all prime examples. As far as the present picture on the Xcite Energy daily chart is concerned, we are looking at a gap through the 50 day moving average at 13.91p. This is one of the more reliable setups in the charting textbook, with the risk/reward an attractive end of day close back below the 50 day line. The upside at this stage is seen as being as great as the top of a rising October price channel with its resistance line projection pointing as high as 25p. This would easily clear the 200 day moving average currently just above 23p. The timeframe on such a move is regarded as being as soon as the next 4-6 weeks.
Comments (0)