Zak’s Daily Round-Up: ABF, AHT, MKS, CBUY and PREM

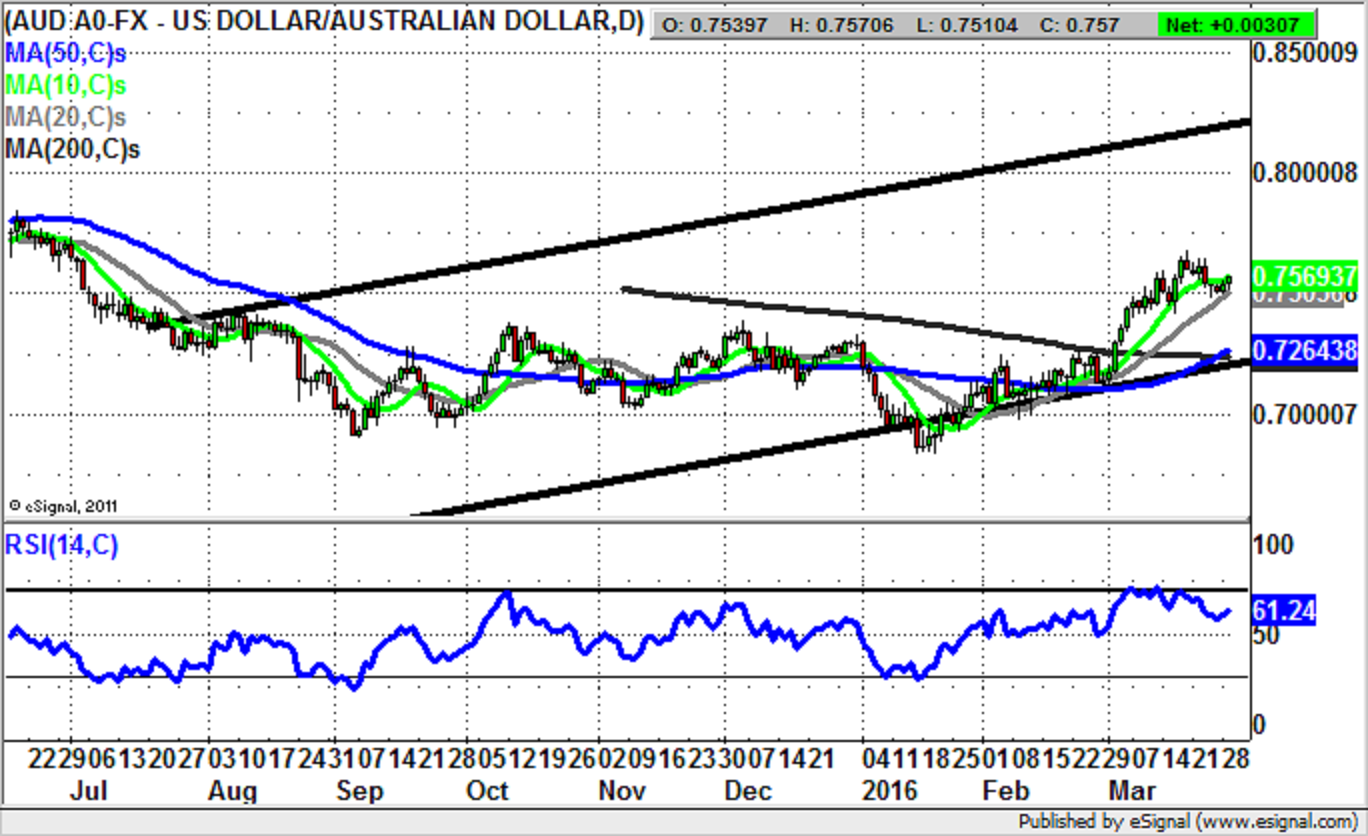
Market Direction: Australian Dollar above 0.74 Targets Towards 0.82
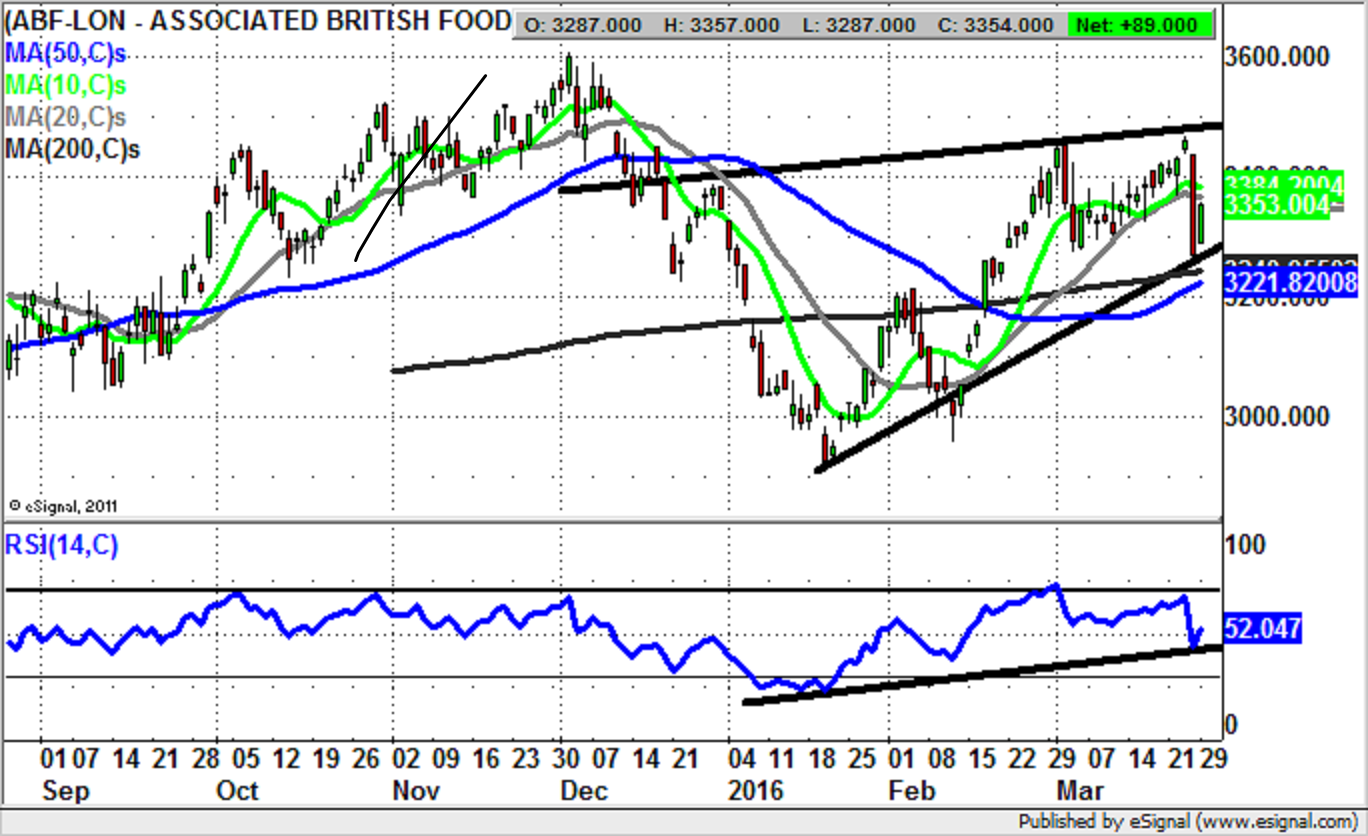
AB Foods (ABF): Run Up To Golden Cross
Although it may appear obvious to some – myself – that Primark to sugar producer AB Foods should spin off its discount fashion group, so far it is seems that the company is happy to rest on its laurels. Given the uncertainties of the financial markets in general, and the retail sector in particular, it may very well be the case that not going for the spivvy approach is the right thing to do. Only time will tell. At least from a technical perspective it can be seen on the daily chart of this FTSE 100 company that there has been the December and January support and resistance levels – just under 3,000p and up to 3,600p, with the main focus here over the near term being the 50 day moving average at 3,221p and the 200 day line at 3,248p. What is interesting currently is the way that support on the latest dip has come in here just above these key technical features, given the way we are notionally in the run up to a golden cross buy signal. All of this would go to suggest that provided there is no end of day close back below the 50 day line we should give the benefit of the doubt to the buy argument and the possibility of a retest of the main 3,600p zone as soon as the end of next month. At this stage only an end of day close back below the 50 day moving average would really be enough to warn of a delay to the upside scenario.
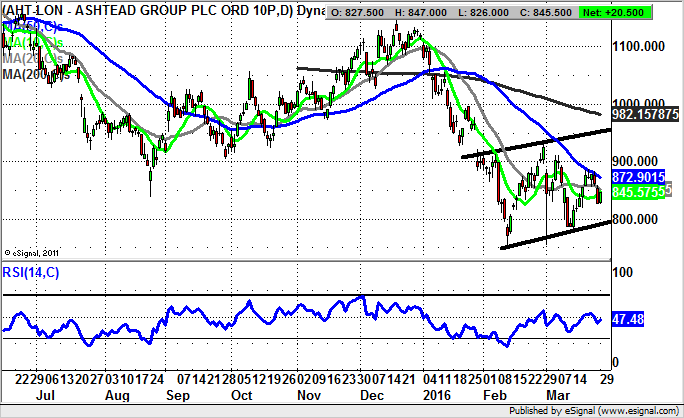
Ashtead Group (AHT): Likely Downside Continuation
One of the minor, but useful rules of technical analysis which I rely on is when the RSI pushes up through the neutral 50 level – to get it nominally in the bullish zone – but then fails, thus reinforcing a bear situation. This is what we have been seeing on the daily chart of Ashtead Group so far this year, with the post February oscillator pattern consisting of RSI failures between 50 and 60, before fresh price action breakdowns. The risk now is that we may still see a dip towards the floor of the trend channel drawn from the beginning of last month, with its support line projection running at 800p. Indeed, at this stage only back above the 50 day moving average at 872p on an end of day close basis would really even begin to imply the breakdown here from the end of December was likely to end in a sustained fashion.
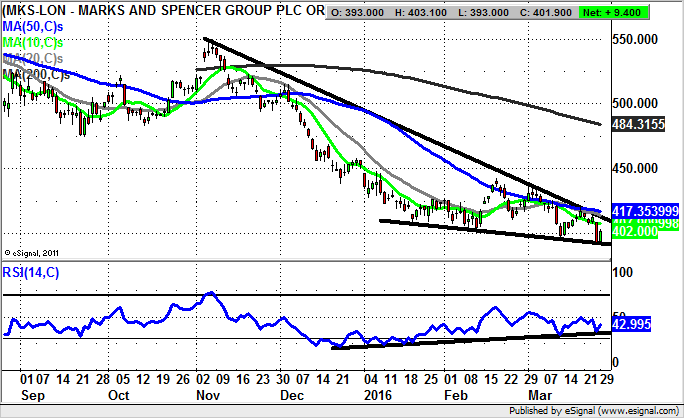
Marks & Spencer (MKS): Bullish Falling Wedge
One of the points to note ahead of any technical analysis on Marks & Spencer is to remember the way that although this is no volatile mining stock, it is a deceptively difficult play to get a handle on, even in what appears to be the most obvious of situations. This is perhaps something which should be remembered currently as we look at a setup where there has apparently been a falling wedge formation opportunity. Such bullish formations are normally very reliable, especially as they present would be bargain hunters to go long at the bottom of the range. Indeed, the intraday low of the year to date made last week at 391p gives us a relatively tight end of day close stop loss as we seek out an initial journey to the 50 day moving average / wedge top at 417p. However only an end of day close above this combination of resistance would indicate a decent upside to shoot for at the 442p February intraday high over the next 4 weeks.
Small Caps Focus
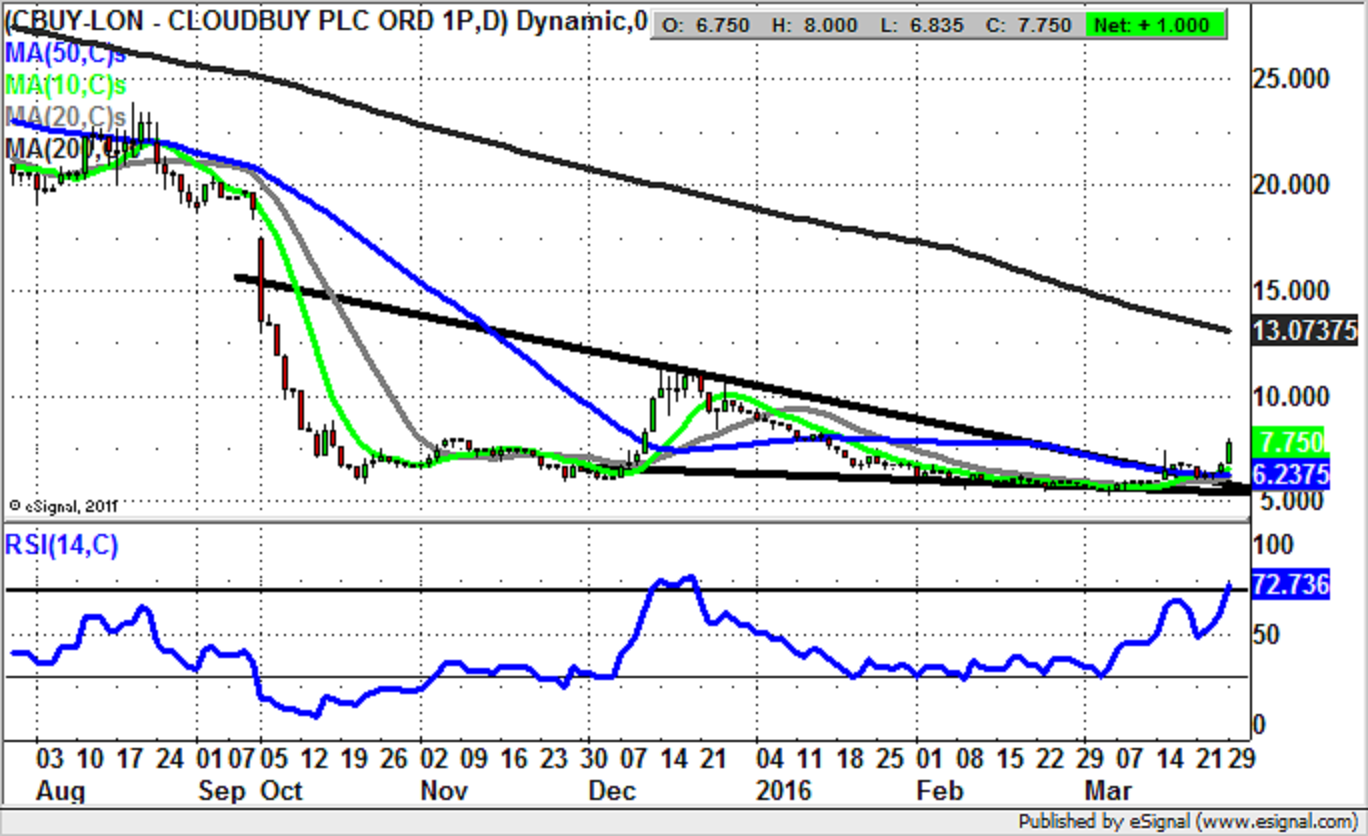
Cloudbuy (CBUY): Wedge Reversal Targets 11p Plus
What can be seen on the daily chart of Cloudbuy is the way that the shares have been bubbling under for quite some time, with an extended base in place on the daily chart since as long ago as October – all of this above the 5p level. The present position shows how we have seen a bullish falling wedge formation broken over the past couple of sessions, with the break of both the October resistance line of this wedge, and the 50 day moving average at 6.23p both very constructive. All of this should go to mean that provided there is no end of day close back below these two features we can expect decent further upside, over and above what has been seen over the recent past. The favoured scenario is for a 4-6 weeks journey to deliver a retest of the former December resistance zone at 11p plus, with any dips in the meantime back towards the 50 day line regarded as buying opportunities. In fact, it should be the case that by the time Cloudbuy gets back towards the former December resistance zone, we should see the falling 200 day moving average at 13.07p back down in this zone as well.
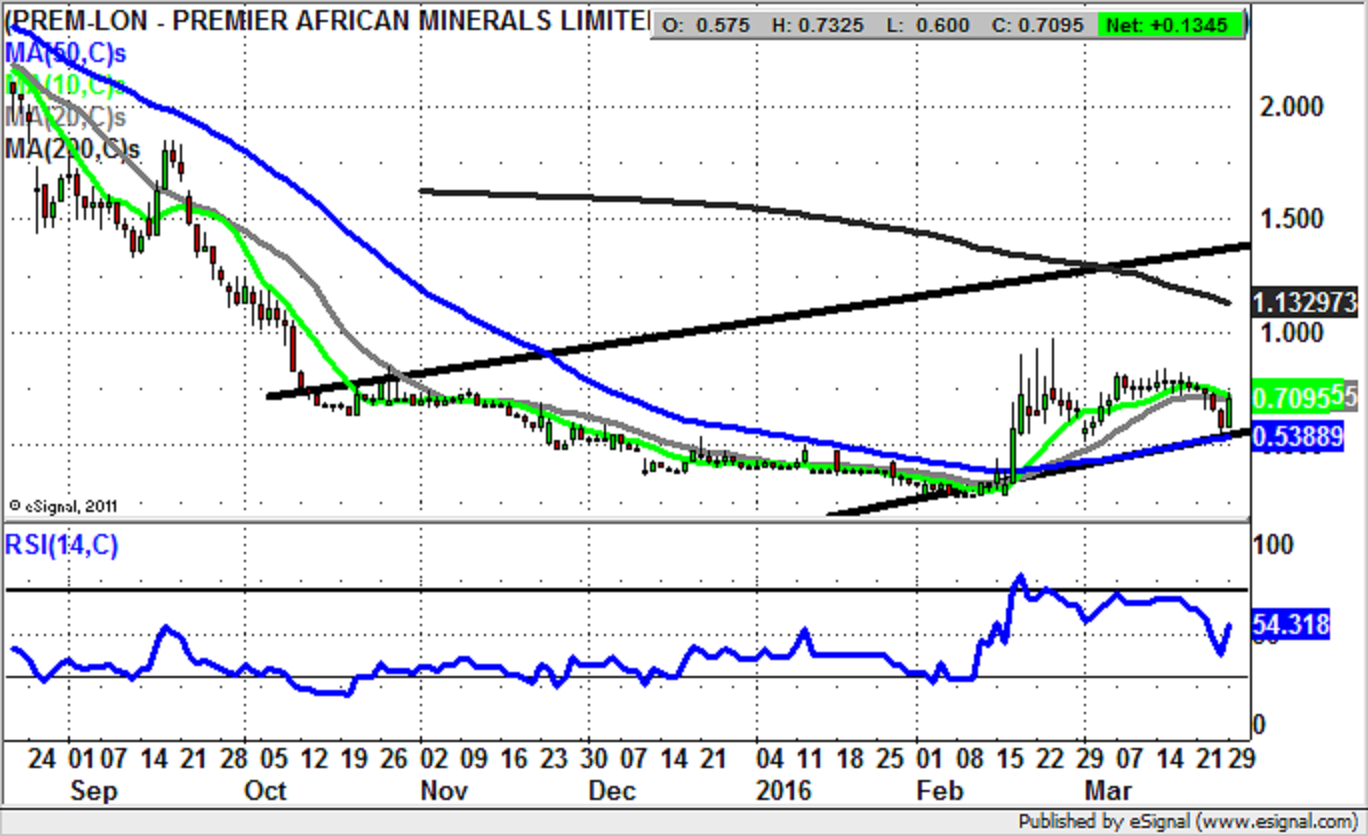
Premier African Minerals (PREM): Main 0.5p Support Zone
Premier African Minerals has been a decent recovery situation, helped along by the recent massive recovery in all things to do with mining stocks. However, the issue now is whether the momentum will be maintained. As things stand it would appear that leading mining stocks are on the back foot, but that the likes of Premier still have some decent momentum behind them. In the case of this situation one would expect to see a build higher after the March double bottom off the 0.5p zone / 50 day moving average at 0.53p. At least while there is no end of day close back below this feature the upside for Premier African Minerals could be as high as the top of a rising trend channel from October at 1.4p on a 2-3 months timeframe. This is especially the case given the latest recovery of the 10 day moving average at 0.7p, which is a feature usually associated with momentum being back with the bulls once it is cleared.
Comments (0)