Zak’s Daily Round-Up

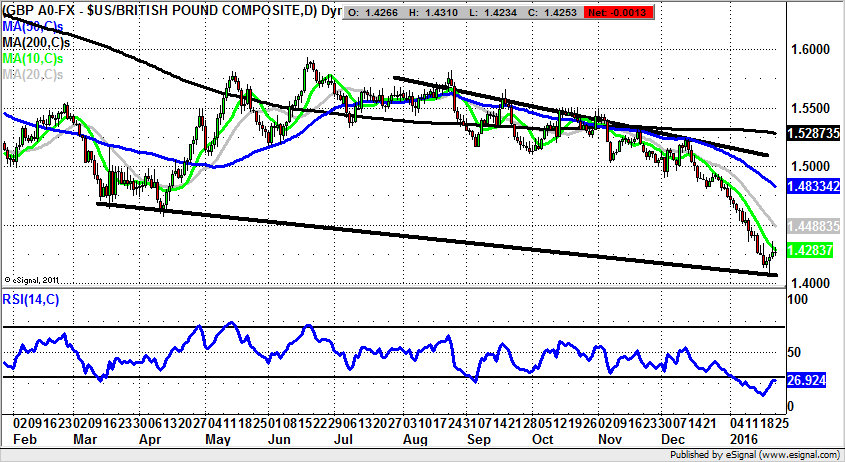
Market Direction: Above $1.40 Targets Back Towards $1.45 for Cable
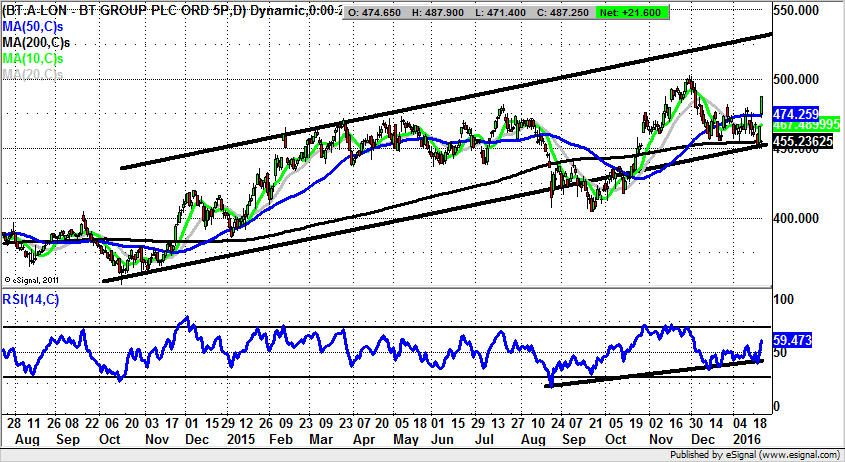
BT Group (BT.A): Bear Trap Reversal Leads to 530p
BT Group is a stock I have been stalking for a number of days, and had meant to write up mid week last week. It is perhaps just as well that I did not, given the price action which ended the week. This delivered a quite decent bear trap gap rebound from just below the 200 day moving average now at 455p. Added bullish credentials have already been in place ahead of the latest bounce, both in the form of the late November golden cross buy signal between the 50 day and 200 day moving averages, as well as a multi tested RSI uptrend line in place since as long ago as August. These factors made it all the more important for technicians to adopt something of a wait and see approach in terms of a possible breakdown for BT Group shares in sympathy with the FTSE 100’s declines of January. The call now is that we are most likely being treated to a new sustained leg to the upside, a point backed by the latest gap through the 50 day moving average at 474p. The implication of all of this is that provided there is no end of day close back below the 50 day line, one would expect to see a decent acceleration towards the top of a rising trend channel, one which has been in place as long ago as November 2014. This has its resistance line projection currently pointing as high as 530p, a 1-2 month timeframe target.
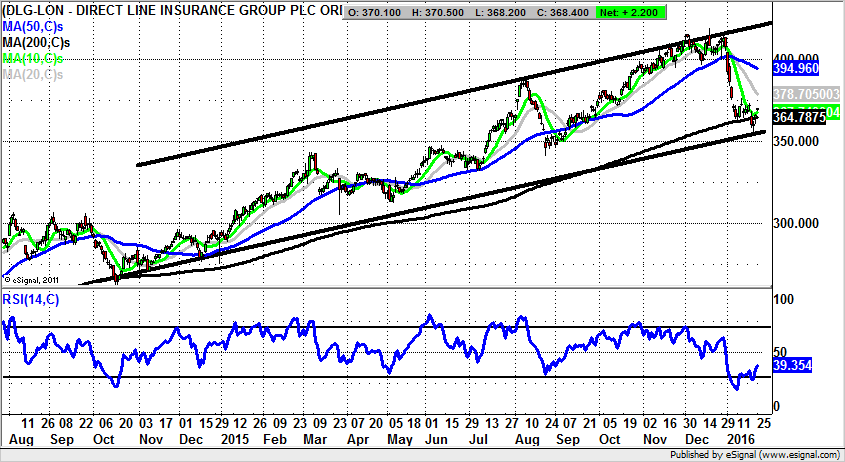
Direct Line Insurance (DLG): Price Channel Target at 420p
One of the alleged benefits of being in the EU is that the Great British Consumer might have been protected from the rip off Britain concept, which is of course still alive and well. Unfortunately, in many areas, such as utilities, financial services and products, we are being suckered as much as we ever were. In fact, it would appear that all that EU membership has achieved is to import the worst of what is on the Continent. The low point in this respect could be said to be the pricing of petrol in litres so that we cannot (easily) work out what a rip off this was/is in miles per gallon. But as far as the stock market is concerned my philosphy is don’t get mad, get even. Insurers rarely go out of business (even Lloyds of London) and with Direct Line Insurance having been sold too cheap by not for profit bank RBS (RBS), it is not surprising to see the stock in an uptrend. Indeed, the view at this point is that provided we do not see any break back below the current January support at 354p on an end of day close basis, the assumption to make is that these shares are heading back to the top of a rising trend channel in place on the daily chart from as long ago as the autumn of 2014. This has its resistance line pointing at the 420p level, a target zone which is expected to be hit over the next 1-2 months helped along by strong bullish divergence in the RSI window.
Bull Call:
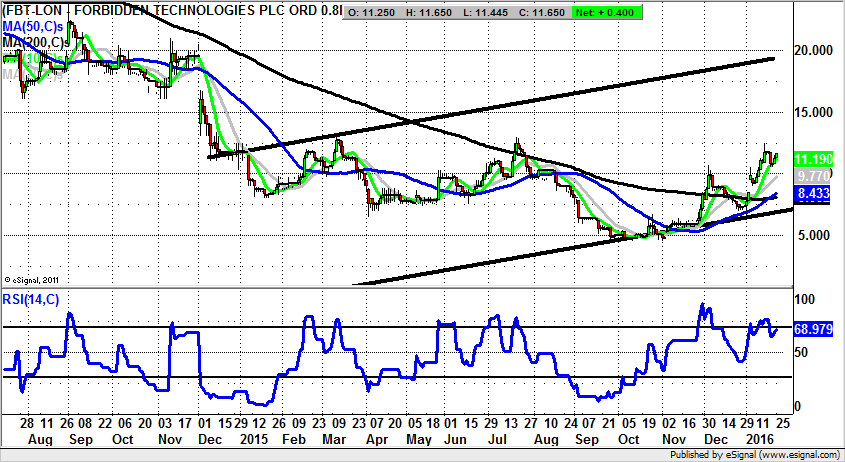
Forbidden Technologies (FBT): Gap Through 200 Day Line Targets 20p
While singing the praises of a stock on a charting basis may perhaps turn out to be the kiss of death, I have done so recently with regard to Forbidden Technologies, and despite this “curse” the stock has continued to advance. Perhaps rather more logical as a driver is the way that the shares remain firm despte the recent stock market meltdown. The explanation for this on a technical basis derives from the way that there have been higher support points on the daily chart since November, a large unfilled gap to the upside through the 200 day moving average for January, and a golden cross buy signal between the 50 day and 200 day lines soon after this month as well. All of this leads us to believe that Forbidden Technologies is one of the more robust charting plays around. As far as what may happen next is concerned, we are looking for support to come in towards the former December resistance at 10.65p. At least while this remains in place as an accumulation zone we would be anticipating a journey towards the top of a rising trend channel which can be drawn in from as long ago as December 2014. This has its resistance line projection heading as high as 20p. The timeframe on the upside scenario is the next 1-2 months.
Bear Call:
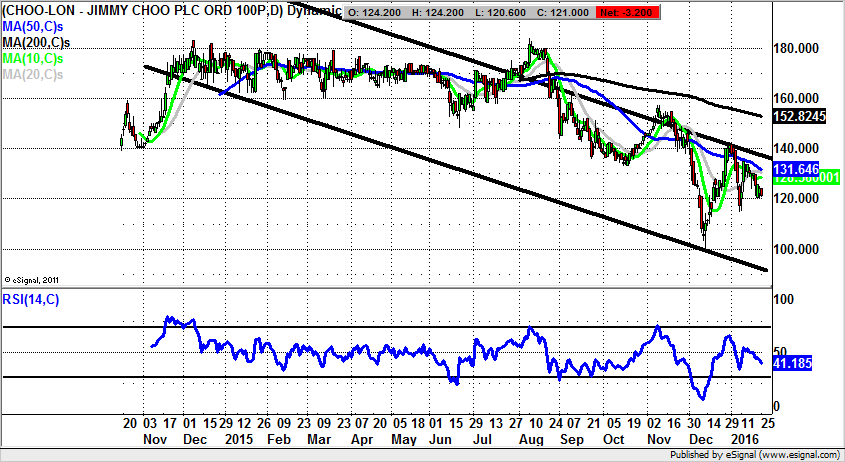
Jimmy Choo (CHOO): Decline Towards 90p Expected
Expensive shoes are obviously a delight in the good times, when one has more cash than sense. But the problem as far as the vagaries of the economic cycle is that such times are relatively rare, even if you are Immelda Marcos. What can be seen on the daily chart of Jimmy Choo since it came to market is the way that initially there was an extended consolidation at the higher levels, with a range either side of 150p. However, the aftermath of the final August attempt at sustaining 180p has been an increasingly negative one. This point was underlined by early September in the way that all the near term moving averages were falling quite aggressively. The vehicle for the subsequent decline has been a descending price channel which can be drawn from as long ago as November 2014. The floor of the channel has its resistance line projection pointing as low as 90p. This suggests we have considerable downside to come, even though over the past few months there has been quite a sizeable decline for the shares. The favoured scenario is that a retest of December’s 99.44p low is on the way over the next 4-6 weeks, and that the share price could overshoot to the downside with a 2014 price channel floor support test at 90p.
Comments (0)