Zak’s Daily Round-Up

Market Position: Euro / Dollar above $1.12 Still Targets $1.16
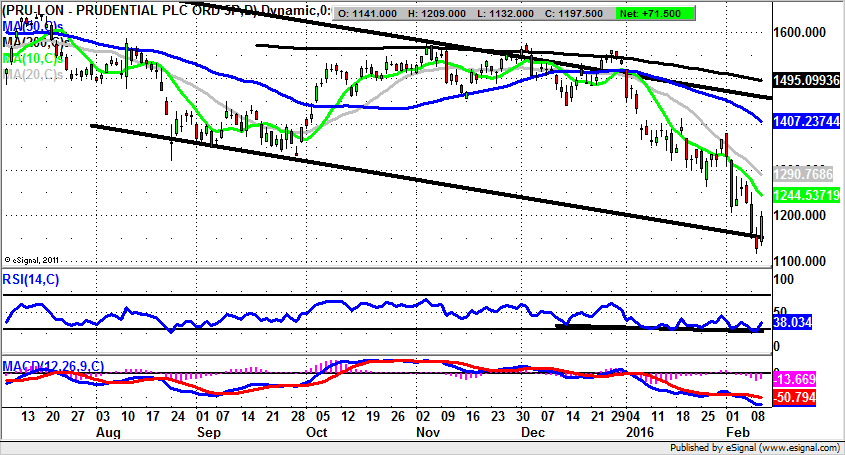
Prudential (PRU): Possible February Resistance Retest
One of the more cruel aspects of the stock market over the past year is the way that the emerging markets, and particularly the Far East, have switched from being something for which it is good for companies to be exposed, to something which is an outright negative. Good examples of how negative is the switch in attitudes and sentiment are to be found in companies as diverse as Burberry (BRBY), Standard Chartered (STAN), mining companies and, in this instance, Prudential. Interestingly, the golden days of the Far East expansion in both geography and profits were seen under the guidance of the former CEO of the insurer Tidjane Thiam. He is now CEO of Credit Suisse, where he is hoping to work similar magic. Alas I would venture to suggest that on this occasion his walking on water reputation may take a bit of a dunking. But at least looking at the daily chart of the Pru it can be seen how we could be overdue a rebound after what has been quite a crushing breakdown for the shares over the past six weeks. The pain started with an unfilled gap to the downside through the 50 day moving average then around the 1,500p mark, and in the aftermath of a narrow bull trap through the 200 day moving average – a classic reversal signal in the 1,550p resistance zone. But what can be seen now is the way that we may be bottoming out at the floor of a falling August trend channel based at 1,145p. The issue now is that while there is no end of day close back below this 2015 support line we could see tentative basing moves. The favoured upside while there is no end of day close back below 1,145p is a retest of the initial February peak at 1,379.5p. This could be offered as a best case scenario target over the next 2-4 weeks, after which the possibility of a sustainable interim rebound would fade.
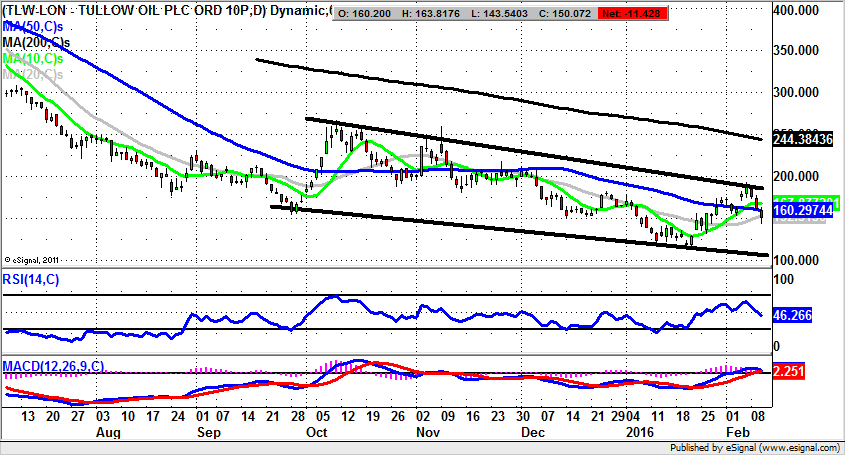
Tullow Oil (TLW): Gap Fill Reversal Could Lead Back to 2016 Support
The recent history of Tullow Oil has not exactly been a happy one on either the technical or fundamental front, something which is hardly surprising given the plunge that no one apart from the Saudis could have foretold – largely as they have been pledged to dump Crude Oil. They have been in good company as the strength of the U.S. Dollar, and emerging markets debt in this currency have forced other producers to panic sell the commodity, and deliver a painful example of negative feedback. As for Tullow Oil, it can be seen how the stock managed to rebound from the second half of last month, off the back of a feeling that under $30 a barrel was an overshoot to the downside, and most likely ahead of the latest update from the company. This has not been pleasant reading for the most part, in the sense that final results have delivered a $1bn loss, off the back of impairments and write-offs. While it could be the case that most of the bad news is in the price, that would be assuming that the worst is over in terms of both demand / supply for Crude Oil, and of course, its price per barrel. In terms of the charting position here currently it can be seen how we have the aftermath of a break back below the floor of the February gap at 164p. The charting scenario at the moment is that provided there is no end of day close back above the last gap, the downside here could be, and may need to be, a partial or even full retest of the 2016 support to date at 117p.
Small Caps Focus
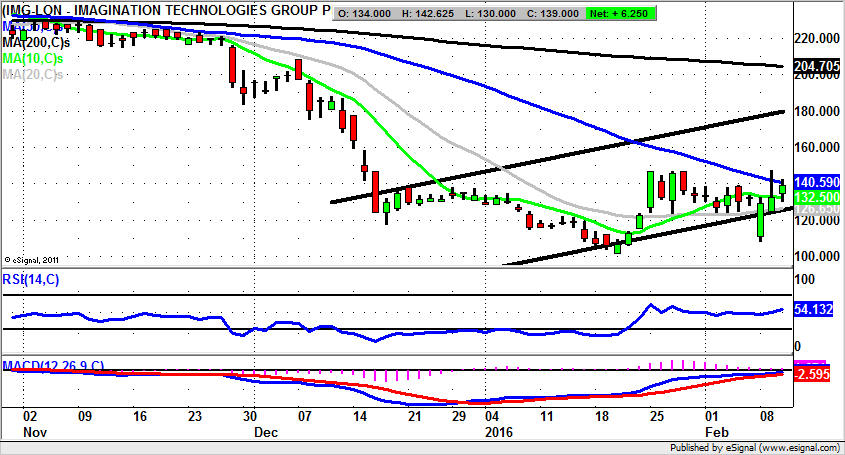
Imagination Technologies (IMG): The News Divergence Trade
It has to be said that as far as the recent history of Imagination Technologies is concerned, there has not been a dull moment, either on the technicals or the fundamental front. The latest profits warning and the departure of the Knighted CEO has actually been accompanied by a rebound for the shares, something which might suggest that either the stock market thinks that the previous direction the company was being steered in was wrong, or that there may be some M&A to dig the bulls out of trouble. Ideally, the chip designing group would be taken out by a larger rival. At least from a charting perspective it is not too difficult to go with the idea of share price recovery here. This is because there has been a sharp January gap fill rebound, with new support coming in below the 20 day moving average / December price channel floor at 126p. The assumption to make now is that provided there is no end of day close back below the 20 day line, we shall see a top of December price channel target as high as 180p over the next 1-2 months.
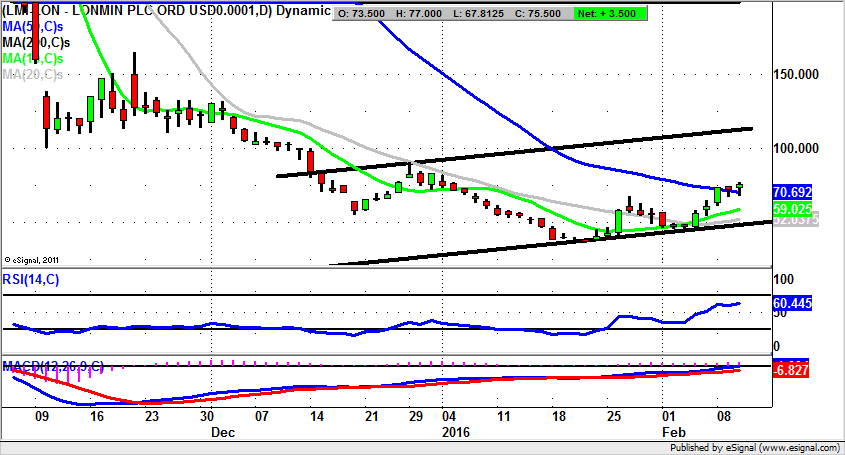
Lonmin (LMI): Above 50 Day Line Targets 110p
It is of course with a certain sense of trepidation that one brings forward the daily chart of Lonmin as a potential shorting situation. This is because the mining group has seen its shares battered intensely, even by the standards of a very hard hit sector. Just how bad the situation has been can be seen on the left hand side of the daily chart where there was an exhaustion gap to the downside in November. This gap was filled the following month to provide what have so far been the lows of the recent down wave. But what is interesting now is the way that we have been treated to a three day break back above the 50 day moving average at 70.69p. The view at this stage is that above the 50 day line we shall be on the receiving end of a rally towards the top of a rising trend channel at 110p from December over the next 4-6 weeks.
Comments (0)