Zak’s Daily Round-Up

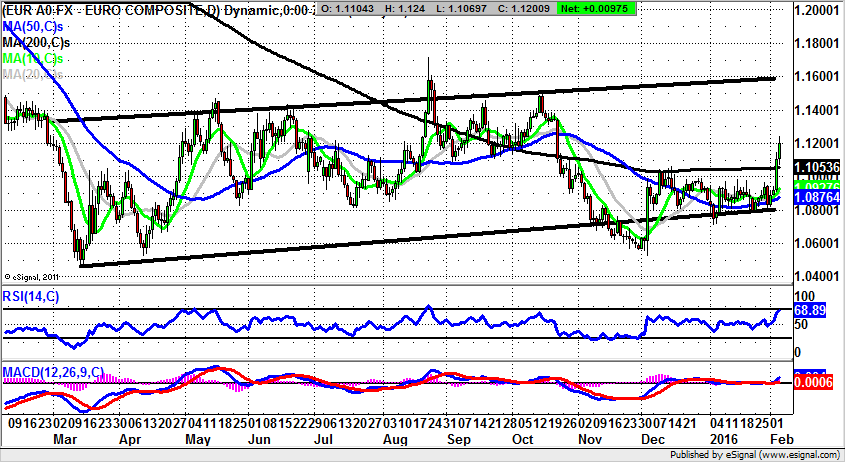
Market Position: Euro / Dollar Breakout towards $1.15
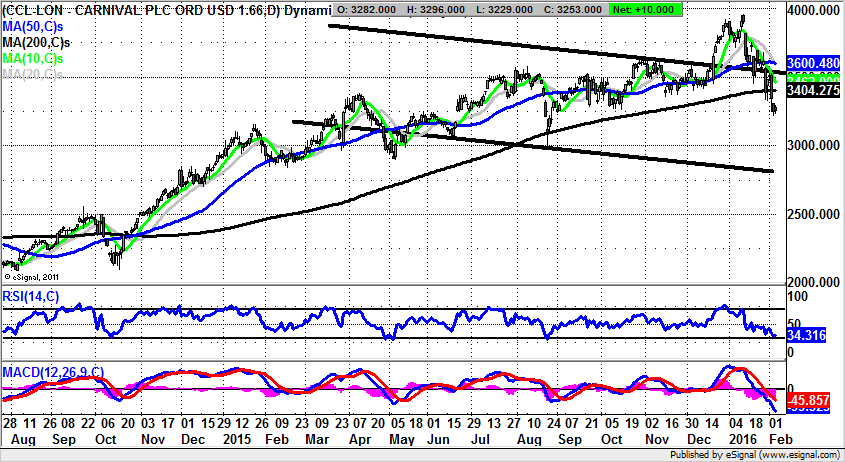
Carnival (CCL): January Top Risks 2,800p
It seems appropriate to look at travel stocks, given the way we have the double fundamental issues of the ongoing oil price plunge, and the emerging threat of the Zika virus, a phenomenon which looks to be something of a fait accompli so far as the extent to which it has spread in Latin America and beyond. Given the nature of this epidemic it would seem surprising for there to be a desire for many, whether pregnant or not, to engage in tourism or business. At the same time, the assurance by the Brazilian authorities that the Olympics will be safe appears not to be medically founded, but rather a commercial one. As for the prospects for cruise operator Carnival, it would appear that there could be more of an impact here than either from the Ebola episode or even the ongoing terrorism issues – especially around the eastern Mediterranean. What is evident on the daily chart is the way that the stock has not been able to recover from the bull trap double top and subsequent gap down. This still overshadows the price action a month later, with a failure below the 50 day moving average at 3,605p to start this month, and then the latest loss of the 200 day moving average at 3,403p this week. The risk now is that, provided there is no end of day close back above the 200 day line, we could see further significant downside. Just how low this could be is suggested by the floor of a March falling trend channel with its support line projection pointing as low as 2,800p. The timeframe on such a move is seen as being as soon as the next 2-3 months.
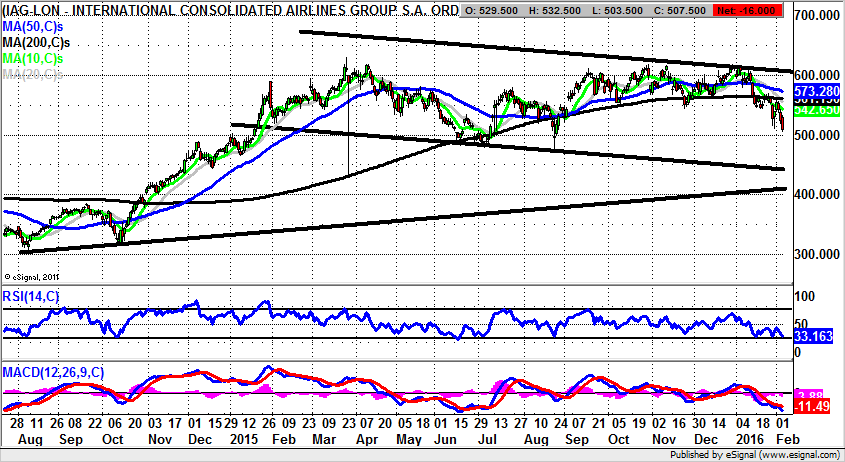
International Consolidated Airlines (IAG): Extended Top Targets 430p
It may be said that given the strong passenger numbers that are still continuing for the flag carrier (helped by the ongoing low fuel prices), the daily chart of International Consolidated Airlines should of course be out and out bullish. The question is therefore why is this not the case? The obvious answer should be that it is being dragged down by the overall breakdown in the FTSE 100 below 6,000 to start 2016. This may provide some of the answer, but even if this is the case, the possibility here is that there is a sea change in sentiment and a trend change on the way for the price action. The Zika virus may prove to be the culprit on its own, as it would clearly be a dampener on discretionary travel to Mediterranean / tropical areas. As far as the detail on the daily chart is concerned, we are looking at an extended top which has been in place from as long ago as this time last year. The gaps that we have seen towards this region, especially since September, underline the way that there was plenty of effort on the part of the bulls to clear 600p on a sustained basis; but alas this was to no avail. The present position is that we see an initial February failure at the 200 day moving average, which is now falling along with the other near-term moving averages at 561p. The risk now is that while there is no end of day close back above the 200 day line, the downside for International Consolidated Airlines could be as low as 430p – the floor of last year’s falling trend channel. The timeframe on such a move is the next 1-2 months.
Small Caps Focus
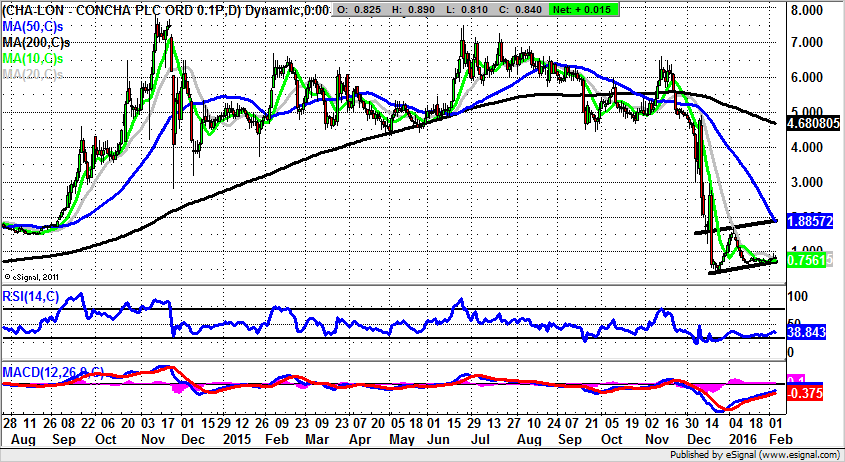
Concha (CHA): Initial Base Building
There will be few who would deny that the autumn of 2015 was a nightmare period for shareholders of Concha. This point is underlined by the way that there was a near vertical decline for the stock over the course of December. Not surprisingly, the recovery process after a brief selling climax probe below 0.5p has been rather tentative at best. What is interesting here is the way that December first brought in bullish divergence in the RSI window, and then a buy cross in the MACD window soon after. While these buy signals may not necessarily prove compelling in isolation, the combination of them, as well as higher support points above 0.5p since December, do suggest that there could be a fresh extended positive price action phase here. What would certainly help is an end of day close back above the initial February resistance at 0.94p made yesterday. If this is seen on a weekly close basis one would be happy to call up Concha shares for at least an intermediate rally back up to the top of a December rising trend channel / 50 day moving average at 1.97p over the next 4-6 weeks.
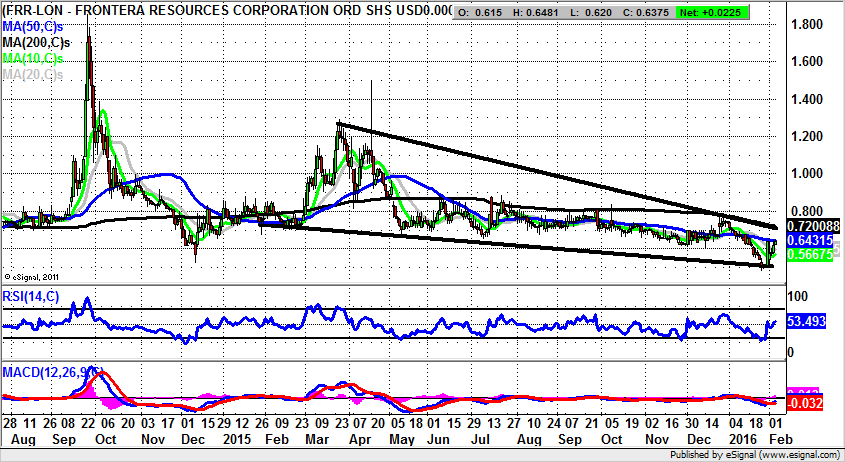
Frontera Resources (FRR): Possible Wedge Reversal
Relatively recently a follower on Twitter asked me whether it was time to revisit the charting prospects of former Bulletin Board Hero stock Frontera Resources. What can be clearly seen on the daily chart is the way that there has been an extended wind down for the shares since the March / April double top through 1.2p. All of this has occurred within an extended wedge formation, which hopefully will resolve itself via a break to the upside. The break level is the top of the formation – a line running through 0.72p, also the level of the 200 day moving average. On this basis we have an initial target level here while there is no end of day close back below the bottom of the 2015 formation’s support line at 0.5p, one would expect further positive consolidation to occur. Just how high the stock could stretch on any clearance of the 200 day line is suggested by the post June resistance zone as high as 1.2p. However, it should be noted that the “easy” call here is for the 200 day moving average to be hit, and no more.
Comments (0)