Zak’s Daily Round-Up

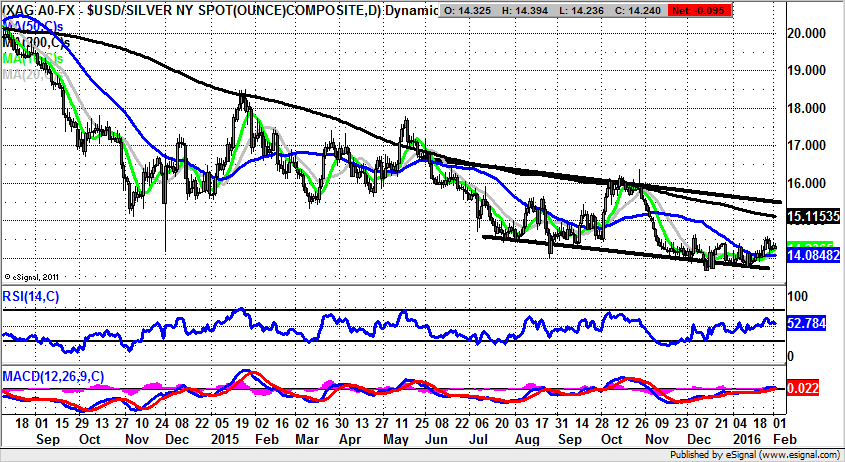
Market Direction: Above 50 Day Line Targets $15.50 for Silver
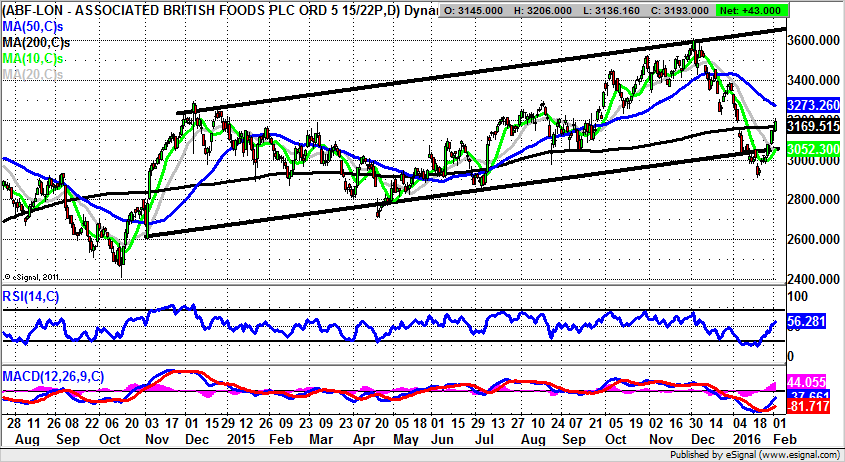
AB Foods (ABF): Above 200 Day Line Targets Towards 3,400p Initially
One of the great mysteries of our age is of course how Jeremy Corbyn became Labour Leader. The other is how AB Foods continues to operate as a weird combination of a sugar producer and Primark owner. Given the way that Primark is no less phenomenal in its space than Ikea, one would presume that there would be even more shareholder value unleashed by splitting the two entities than is present in the odd couple arrangement which exists at the moment. The only negative, one supposes, as things stand is the rather dire state of the stock market – in which many babies are washed away with the bearish bath water. That said, while it can be seen on the daily chart of AB Foods that the shares have been hit hard ahead of the all important verdict on the Christmas trading season, the rebound so far actually appears to be almost as sharp. This is said on the basis of the two day island reversal formation for January, with this consisting of the gap to the downside and then the gap higher. As can be seen, last month delivered no less than four gaps to the downside, before the turnaround came. The presumption to make is that this kind of price action would have ejected all but the most ardent of bulls from their positions. Hence, in the aftermath of these antics one would assume the bounce could be all the more powerful. In terms of what this may be, we are looking to the late December resistance at 3,386p as the end of February target given the latest break of the 200 day moving average at 3,169p. The target is valid while there is no end of day close back below the December 2014 price channel floor / 10 day moving average at 3,052p.
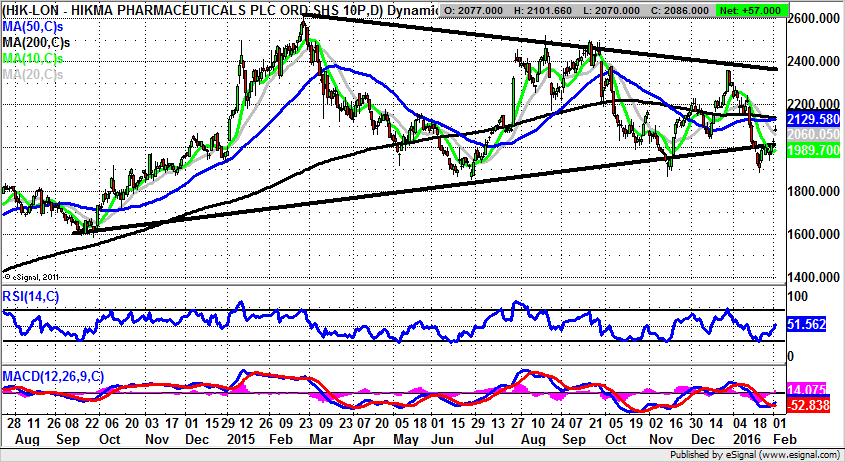
Hikma Pharma (HIK): 2014 Triangle Target
Although it could be said that shares of Hikma Pharma have a relatively regular trading range of 1,900p–2,400p in place on the daily chart, the problem here for traders is that the turning points have been rather too sharp to be comfortable. This point is underlined by the way that September and November turning points of sell and buy respectively were accompanied by gaps, which are phenomena that are difficult to negotiate, even at the best of times. As far as the present position is concerned, it can be seen how the latest rebound was “predicted” by a buy cross in the MACD window – one of those signals which reinforces this indicator as one of the genuinely few reliable leading indicators in technical analysis. Of course, given the relatively large gap to the upside we have just been treated to, there is a degree of difficulty in getting positioned correctly in Hikma, if as is logical, you wish to be near-term bullish. But at least it can be said that, provided there is no end of day close back below the floor of the February gap at 2,037p, we have an opportunity to go with the momentum move and target as high as the top of the late 2014 triangle at 2,375p. The timeframe on such a move is seen as being as soon as the next 4-6 weeks, and perhaps even more promptly on any quick clearance of the 200 day moving average at 2,144p later this week.
Small Caps Focus
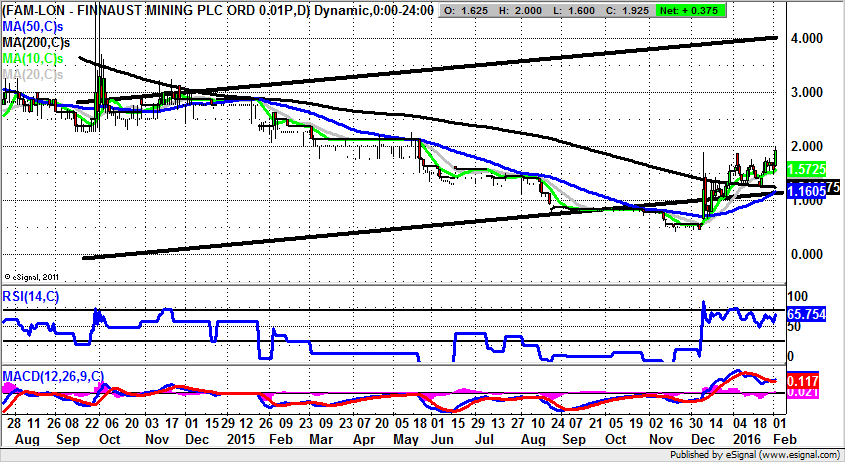
Finnaust Mining (FAM): Above Gap Floor Targets 4p
It may be the case with the recent recovery for shares of Finnaust Mining that it has been easiest to be cautious on the sidelines, rather than wading in with full bullish intent. This is even though the stock delivered a quite overt signal that it was in turnaround mode, with the as yet unfilled gap to the upside through the 50 day moving average in early December. This is what I somewhat colloquially refer to as a “rocket launcher” formation, something which is perhaps a little overdramatic but does at least emphasise the momentum behind such a move. The view currently is that we are looking at a situation which is gathering a decent amount of robustness. This is said in the wake of the extended consolidation we have witnessed since the end of December for the shares at and above the 200 day moving average at 1.24p. The idea of solid recovery has been further added to by the aftermath of the mid January two day island reversal off the 200 day line. All of this suggests that, provided there is no end of day close back below the gap at 1.45p, the upside here could be as great as the autumn 2014 price channel top as high as 4p over the next 2-3 months.
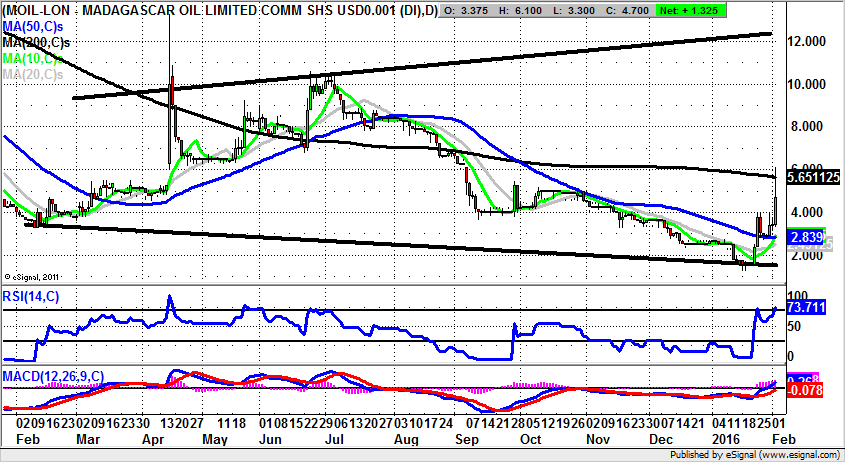
Madagascar Oil (MOIL): Broadening Triangle Highlights 12p on a 200 Day Line Break
While it has to be admitted that the recent history of Madagascar Oil has not exactly been a happy one on the fundamental or the technical side, the position at the start of February does appear to be rather more robust than at any time in the past year. Quite how long this continues to be the case given the fresh slide in Crude Oil obviously remains a matter of conjecture, but the truth of the matter is that for many fans of the sector it is likely to be the case for quite some time that, ironically, the small caps hold more bargain hunting appeal than the likes of BP (BP.) and Shell (RDSB). Looking at the detail of Madagascar Oil shares at the moment, it can be seen that there is a bull flag with its base resting on the 50 day moving average at 2.82p. The message is therefore that, provided there is no end of day close back below this feature, we can once again target the 200 day moving average at 5.64p. A weekly close above the 200 day line could bring us the prospect of a journey to the top of a February broadening triangle at 12p over the next 2-3 months.
Comments (0)