Zak’s Daily Round-Up: MKS, PSON, ITM, LAM and SLN

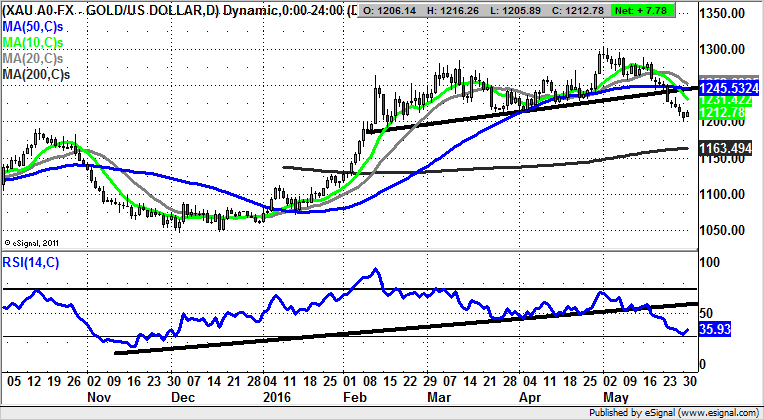
Market Direction: Gold Initial Bear Trap from Below March $1,208 Floor
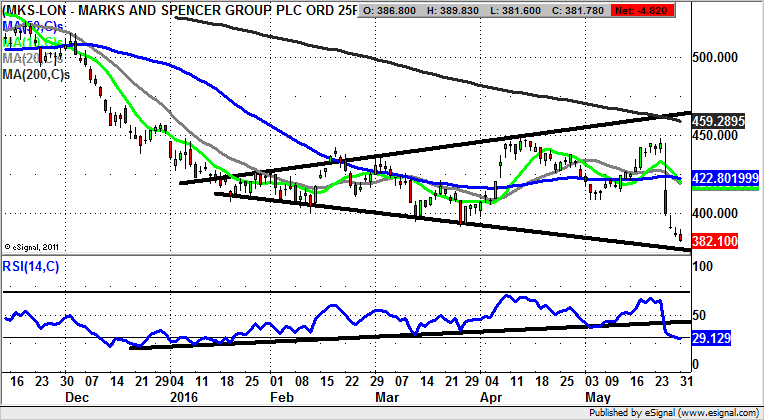
Marks & Spencer (MKS): Key 380p Support Zone
It will be worth seeing what we have on the fundamental front to turn around this high profile retailer, as it looks like it would have to be something special. What can be seen on the daily chart of the stock is the way that there is still a breakdown occurring after the rather painful update from the group earlier this month. The best that can be said in the wake of this event is that the shares are approaching the bottom of a broadening triangle which can be drawn from as long ago as the beginning of the year. The floor of the channel runs at 380p, with this being a reasonable toe in the water zone to go long of the stock, especially given the way that the RSI, now at 29, is in the oversold zone. The issue here is that should the January line be broken by 10p or more, one would be concerned that a rather major negative re-rating could be on its way. Indeed, at this stage, only an end of day close back above the March intraday low at 391p would even begin to suggest that the worst was over for Middle England’s favourite grocer.
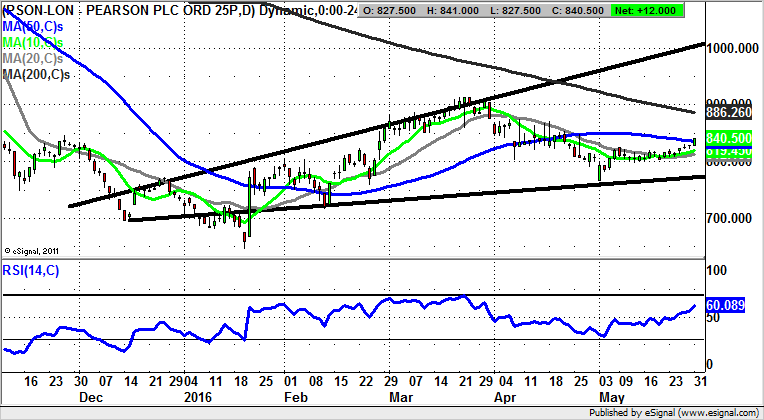
Pearson (PSON): 1,000p as Best Case Scenario
What is noticeable about the recent charting history of Pearson is the way that since the January bear trap gap reversal which marked the low of the move, there have been periodic sharp one day rebounds to underpin the recovery. The last of these came in at the beginning of the month, and since this manoeuvre, another bear trap reversal – from below 802p – we have seen slow, but steady progress. Indeed, the technical view to take now is that provided there is no end of day close back below the former April floor at 802p the latest leg to the upside looks as though it could gather momentum. This is particularly the case if the shares can deliver a decent end of day close back above the 50 day line at 836p. If this can be achieved this week one would be looking for a best case scenario target over the next 1-2 months of 1,000p at a December resistance line projection.
Small Caps
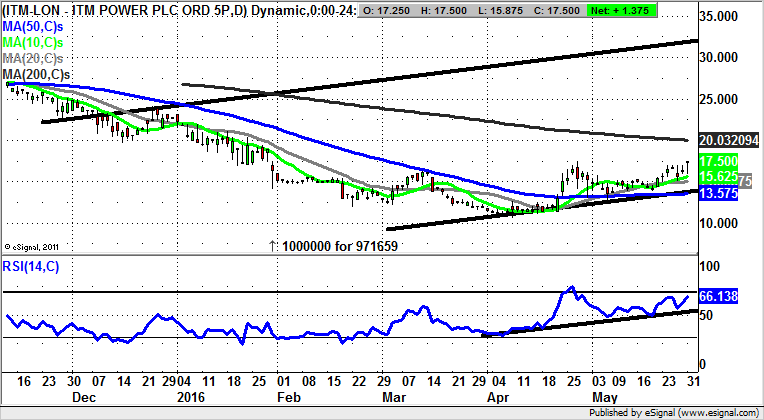
ITM Power (ITM): Above 50 Day Line Targets through 30p
Perhaps what is most interesting about the recent sweep of the price action on the daily chart of ITM Power is the way that we have seen a slow, but steady turnaround for the shares in the wake of the declines seen in the autumn. Indeed, the bulk of the losses last year came in the wake of the loss of the 50 day moving average in November, just below 25p. The current position is that the stock is looking increasingly robust following the reclamation of the 50 day line now at 13.57p at the end of April. The giveaway as far as the strength behind the move is the way that the stock has been led by an uptrend line in the RSI window, now running at neutral 50. As well as this there have been multiple tests of this line and the 50 day moving average over the past month. All of this suggests that as little as an end of day close above April resistance at 17.5p should unleash quite a sharp push higher. The initial target is clearly the 200 day moving average at 20.03p, with a weekly close above this feature implying that we could be treated to a top of December price channel target at 30p plus as soon as the end of July.
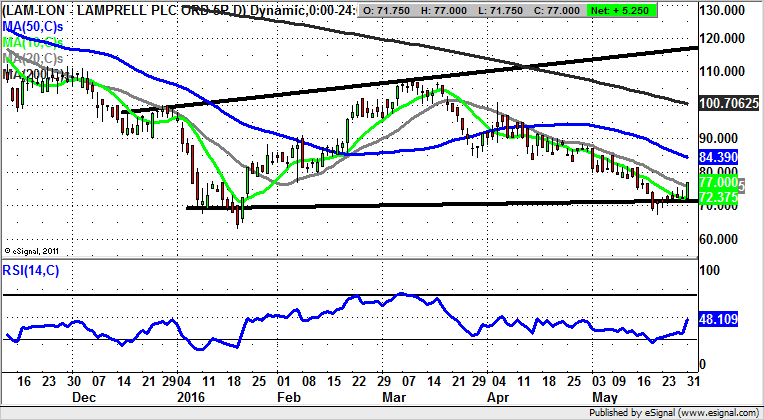
Lamprell (LAM): Eventual 100p plus Target
It may actually be said that the turnaround at Lamprell in recent sessions has been somewhat strange given that it has arguably taken the form of a turn of a dime reversal from just below 70p, forming a higher low versus the floor seen in January. At that time we were treated to a bear trap reversal from below the 65p level. On this occasion we are looking at a chance to target the 50 day moving average at 84p, while there is no end of day close back below 70p. But perhaps what is most interesting is the way that a clearance of the 50 day line would suggest that the post March breakdown is officially over, and that a retest of the trading zone which dominated then could be on its way. Such a break would also open up the prospect of a retest of the 200 day moving average at 100.7p, ahead of a best case scenario target as high as 115p at the December resistance line projection over the course of the summer.
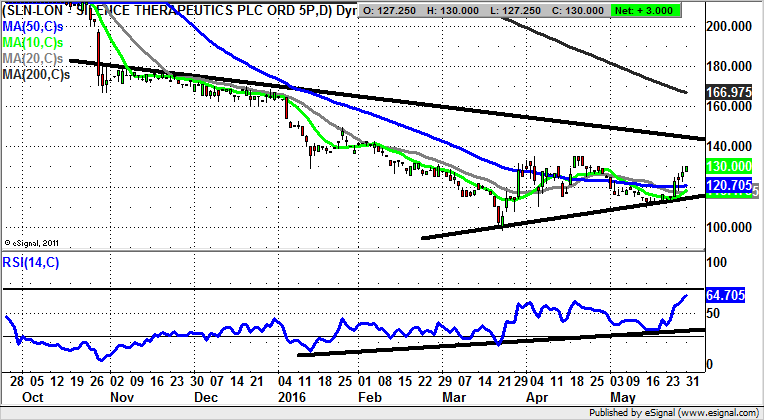
Silence Therapeutics (SLN): Initial 145p Target
Silence Therapeutics is a company I have interviewed on a number of occasions, and while this does not make me an expert in systematic RNA interference, I may be on the way to being a beginner on the subject! As far as the charting perspective is concerned, we have a March–May Adam & Eve reversal (not Cockney Rhyming slang), with the sharp March reversal and May rounded support. Since then we have seen a clearance of the 50 day moving average at 120p, with the hope being that after this month’s higher support above April’s 110p low we could be treated to a further push to the main October 145p resistance line. The timeframe on such a move is seen as being as soon as the end of June, backed by an extended uptrend line in the RSI window based at 35/100. In the meantime, any weakness back towards the 50 day line can be regarded as a buying opportunity. A quick clearance of 145p over the next week is seen as being a decent trigger on a journey to 166p – the 200 day moving average. This could be hit over the course of the first part of the summer, even if we have to wait to see whether the breakdown from H2 2015 resumes after that.
Comments (0)