Zak’s Daily Round-Up: III, ADM, RIO, STAN, BUR, FEVR & MANX

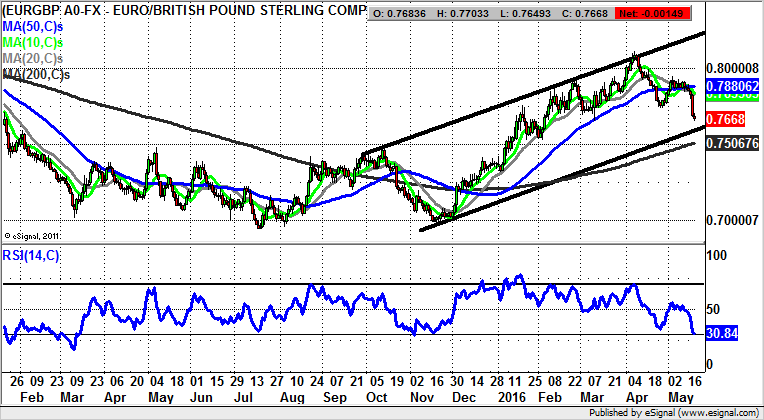
Market Direction: Euro/Sterling Support towards 200 Day Line
3i Group (III): 200 Day Line Leads to 595p
While the stock market may be on the back foot at the moment, it can be seen on the daily chart of 3i that we have been looking at a surprisingly robust picture over recent weeks. This point is underlined by the break above the 200 day moving average at 468p this month, at the third time of asking since the beginning of April. Key in terms of building confidence is the latest clearance of the peak of last month at 486p. This can now be regarded as a decent end of day close stop loss as we chase further gains. In terms of what this may be, we are looking to the top of a rising trend channel which has been in place since September last year. This has its resistance line projection pointing as high as 595p, with the message being that we should expect an acceleration towards this zone over the next 4-6 weeks. At this stage only a weekly close back below the 200 day line would really hint that 3i had reverted to bear mode once again.

Admiral Group (ADM): Technical Target towards 2,200p
For those who wonder whether such technical signals such as golden crosses actually work, they need to look no further than the buy cross between the 50 day and 200 day lines when they were both rising at the beginning of last year. Since then we have seen shares of Admiral Group progress well within a rising trend channel which has been in place since as long ago as October last year. The floor of the channel nominally runs at 1,850p currently, with the message being that provided there is no end of day close back below this number, one would be looking to a new and perhaps significant uptrend beginning. Just how far such a move could stretch is suggested by the 2015 resistance line projection pointing to a 2,180p destination. The timeframe on such a move is regarded as being the next 6-8 weeks. As things stand, only back below the initial March gap floor at 1,786p would really question the bull scenario.

Rio Tinto (RIO): Price Channel Support Break
It would appear that as things stand bulls of Rio Tinto have every reason to be down hearted. This is because the stock has just snapped out of the rising trend channel which was in place on the daily chart from the start of this year. The floor of the channel is nominally at the same level as the present position of the 50 day moving average at 2,072p. The risk now is therefore that while there is no end of day close back above the 50 day line we could see a retest of the 1,795p intraday floor of February, especially given the way that there has been an RSI uptrend line failure from December below 50. The oscillator now stands at 37/100, which suggests that even after recent significant losses there could be further downside as the stock is not yet officially oversold.

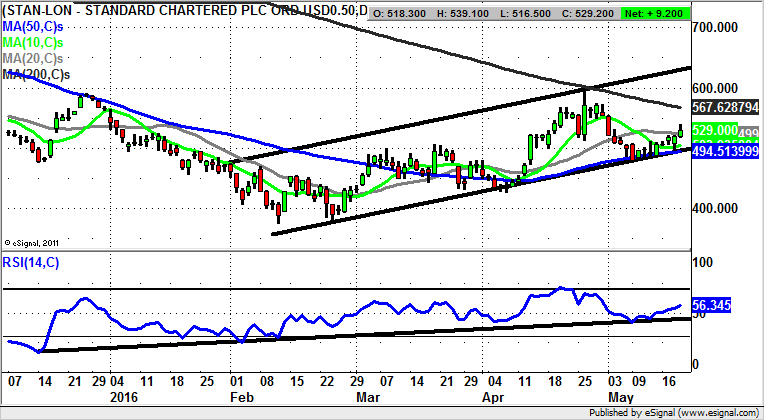
Standard Chartered (STAN): Recovery towards 620p
While it may be the case that Standard Chartered shares do not offer a very intuitive recovery situation on the daily chart, from a technical perspective it would appear we have a slow build for recovery. This is said on the basis that there has been progress within a rising trend channel which can be drawn in from as long ago as the beginning of February. The floor of the channel currently runs at 494p, level with the 50 day moving average. The assumption to make is that provided there is no end of day close back below the 50 day line we should be looking towards a top of February price channel target as high as 620p as soon as the end of next month.
Small Caps
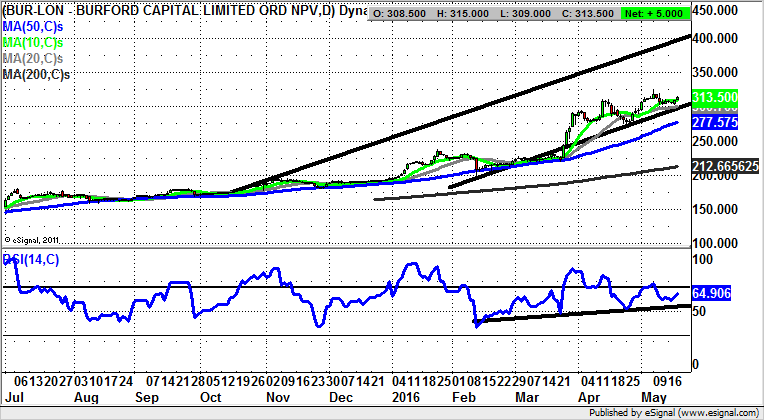
Burford Holdings (BUR): Ultra Trending Situation
As far as bullish situations are concerned you will probably have to go a long way in order to find one that competes with what we are currently seeing on the daily chart of Burford Holdings. This is because there has been a rising trend channel in place since October last year. What is crucial for the long argument is the way that since then the price action has found support almost wholly above the 50 day moving average at 277p at the moment. However, it can be seen how the floor of a rising trend channel from October runs at 300p – level with the 20 day moving average. The assumption to make now is that provided there is no break back below this notional support level, we should be treated to an October price channel top target of 400p over the next 1-2 months.
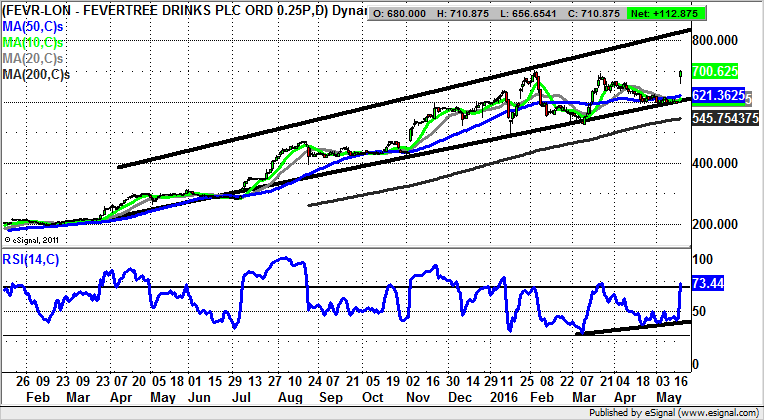
Fevertree Drinks (FEVR): 800p Resistance Line
Characteristics of the Fevertree Drinks daily chart have included old resistance coming in as new support on a consistent basis, as well as unfilled gaps to the upside triggered new sustained legs higher. All of this allows us to project the stock yet higher, even after the significant gains already seen. Indeed, it looks as though Fevertree Drinks could stretch as high as an April resistance line projection at 820p over the next 4-6 weeks. Only under the top of today’s gap at 656p would even begin to suggest that the rally was close to running out of steam.
Manx Telecom (MANX): 2015 Price Channel
The ideal scenario in charting is that the 200 day line will be rising for a bull situation and that the occasional dip towards this zone can be regarded as a buying opportunity. This is exactly what we have been witnessing at Manx Telecom where there has been a rising trend channel in place since as long ago as January last year on the daily chart. The latest rebound came off the floor of the channel at 207p, and while above this on an end of day close basis the upside is seen as being the 2015 resistance line projection at 240p over the next month.

Comments (0)