Zak’s Daily Round-Up: BT.A, MRW, RSA, ARG, FTC and NRRP

Market Direction: Sterling/Dollar Initial $1.45 Zone Support

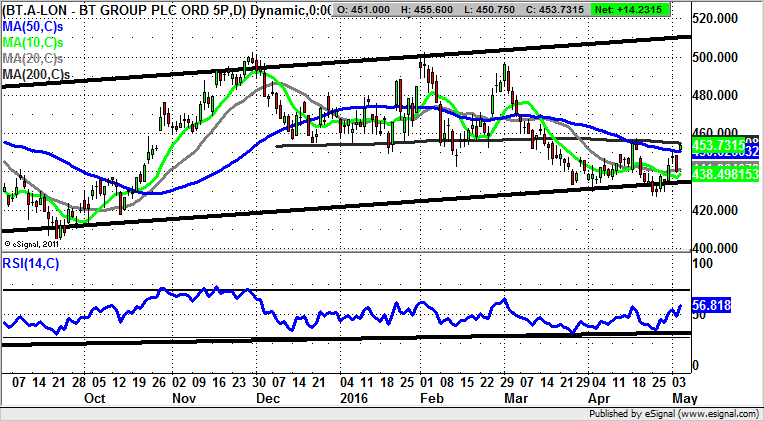
BT Group (BT.A): Island Reversal
One of the plus points of keeping a regular eye out on the more popular FTSE 100 stocks is the way that one gets hints from the charting configuration to build up a greater idea than most of what is going on. This is certainly the case as far as BT Group is concerned, where it can be seen how the stock has been bumping along the bottom of a trading range which has been in place since the end of March towards 430p. The position now is that we are looking at the aftermath of a gap to the upside through the 50 day moving average at 450p. This is interesting not only as a buy signal in itself, but also on the basis that the gap completes an island reversal formation which has been in place since as long ago as the middle of last month. You can also add in the latest RSI trace rebound off the neutral 50 level. The floor of the gap is at 448p, with the ideal scenario being that there is no end of day close back below the gap ahead of a fresh leg to the upside at the top of the range at 500p. The timeframe on such a move is the next 1-2 months. Cautious traders would wait on an end of day close back above the 200 day moving average at 455p before taking the plunge on the upside. Clearly back below 430p would question the idea of a bullish prospect in BT Group on a technical basis.
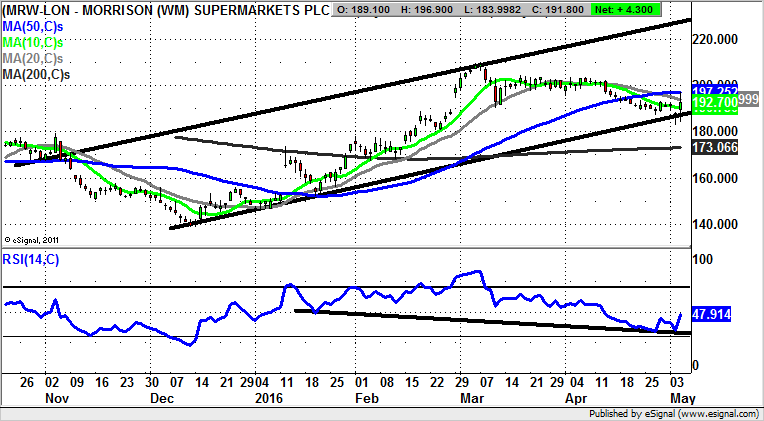
Morrison Supermarket (MRW): 50 Day Line Trigger to 225p
It has to be said that if this was not a daily chart of Morrison Supermarket one might be even more bullish on the technicals here. In other words the price action here is as positive as if we were looking at a prospective M&A situation. The reason for the relative enthusiasm here stems from the way that it is possible to draw a rising trend channel on the daily chart from as long ago as November. The floor of the channel currently runs at 187p, close to initial May intraday support. But the big technical trigger here would be if we are treated to an end of day close back above the 50 day moving average at 197p. The result of this would be a possible move to the top of the November rising trend channel as high as 225p. The timeframe on such a move is seen as being as soon as 4-6 weeks after any 50 day line clearance.
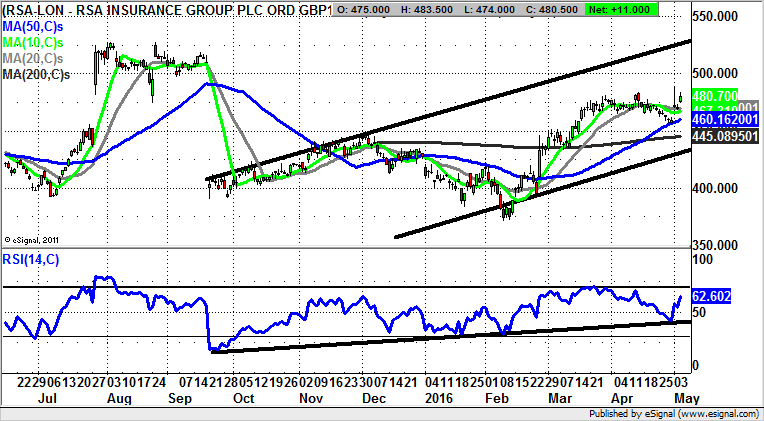
RSA Group (RSA): Golden Cross and Gap Higher
What can be seen on the daily chart of RSA Group is the way that over the post September period it has been quite a journey. This point is underlined by the way that the selloff of the early autumn was so sharp, and then the recovery up to the February turnaround was so long in the making. However, since the end of February we have been treated to surprisingly solid price action. For instance, for the start of March there was a bull flag consolidation at the 200 day moving average now running through 445p, with last month witnessing a golden cross buy signal between the 50 day and 200 day moving averages. The position now is that the gap higher above the 50 day moving average at 460p and recovery of the 50 plus neutral RSI level suggests that while there is no end of day close back below the 50 day line we should be treated to a top of November price channel target as high as 525p. The timeframe on such a move is regarded as being the next month.
Small Caps
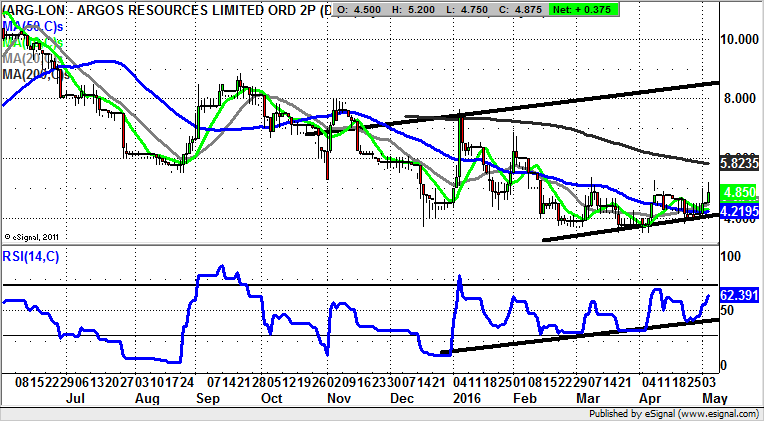
Argos (ARG): Extended Base Points to 200 Day Line
Argos is highlighted here for the small caps on the basis that we have the possibility of looking at an early bird opportunity on a technical basis. This is said in the wake of the extended base put in place since December, an uptrend line in the RSI window since that time, and the latest higher support for the stock above the 50 day moving average at 4.21p. All of this should mean we are looking to a run up towards the area of the 200 day moving average at 5.82p, a zone which could be achieved as soon as the end of this month. The stop loss is no greater than a weekly close back below the 50 day line, something which after such a long basing process would of course be rather surprising.
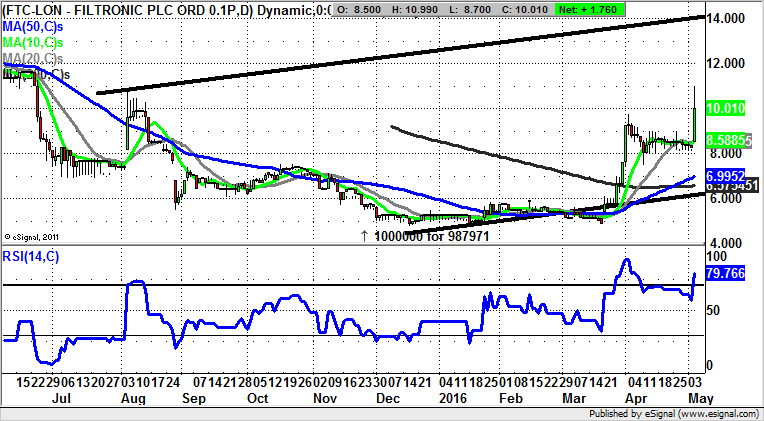
Filtronic (FTC): Target towards 14p
Shares of Filtronic have certainly been on the radar here since the vertical push through the 200 day moving average now at 6.57p at the end of March. What will have encouraged the bulls from that time is the way that the stock has been so strong that no test of the 200 day line as new support has been required. Indeed, last month’s golden cross buy signal emphasised the idea that a fresh leg to the upside could be imminent. Now in the wake of the latest spike we are back to looking for a move towards the top of a rising trend channel from August last year. This is valid while there is no end of day close back below the 10 day moving average at 8.5p.
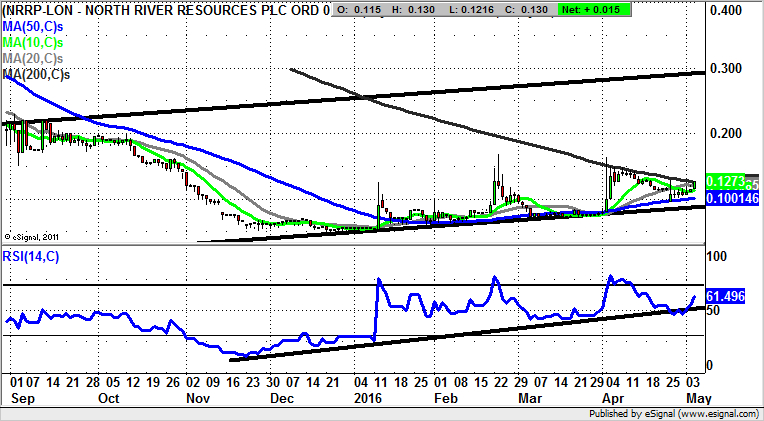
North River Resources (NRRP): Extended Base with 0.3p in Focus
With North River Resources we have witnessed an extended basing process which many might consider to have been rather exhaustive. This is because it has been going on from at least before the turn of the year, with several false dawn breaks to the upside. However, what we are looking for now is a clearance of the 200 day moving average at 0.13p on a weekly close basis to serve up a top of September price channel target at 0.3p over the following couple of months. The stop loss is back below the 2015 channel floor at 0.09p.
Comments (0)