What does the Average True Range (ATR) tell us?
 tell us?")
I’m always sceptical when I see headlines like the one on the Beeb website Business section today: “FTSE 100 Soars 2%”. It’s less than that now, as the market softened since that report went live. It’s more like 1.5% as I write. You can hardly say it’s soaring when the ATR (Average True Range) is 100, which represents around 1¾%. If it is ‘soaring’ with those numbers, then last Friday the 15th when it fell almost 2% it was ‘crashing’.
News sites intentionally use misleading hyperbole to draw you in. It’s a bit poor when they do it in the business section though, where you’d expect some sort of balance. But then the BBC ain’t what it used to be.
The ATR has become a little more commonplace these days, and it’s a very useful tool indeed. The Average True Range is exactly what it says on the tin: it’s an average of the last n ranges or whatever trading period you are looking at (daily, weekly, 5 min, etc.). It’s useful for target and level setting and for a reality check.
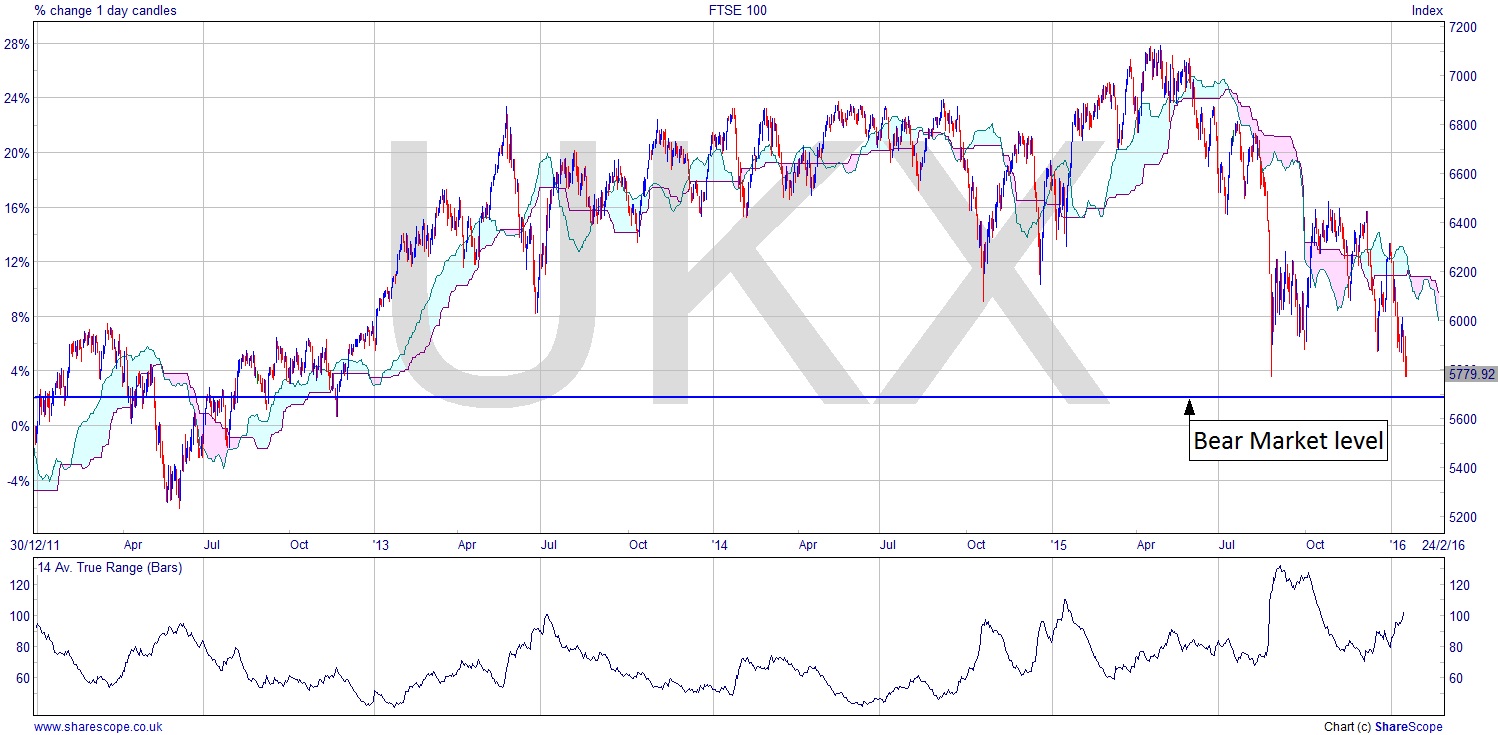
As we can see, on this chart the ATR is around 100. It’s been rising lately so we are seeing increasing volatility. That’s good, as it gives us more opportunity to see bigger moves, and thus more and quicker profits. This is a daily chart, and the daily ATR is a useful guide for intraday trades. If, for example, you want to put on a trade where you have a target 500 points away from the current price action, and you intend to close it during the day’s trading session, then unless there’s some compelling reason why you think the market will move that much, it’s highly likely that the trade will fail. The volatility simply isn’t there to support the expectation.
That said you will never make a killing if you let the ATR rule your life. It’s one tool in a big tool box. But it’s a useful sanity check in terms of how realistic your target is based on recent activity. You should always base trading decisions on a number of key pieces of data and consider the context of that data.
However, the most useful application of the ATR is in setting stop loss levels. If you know the ATR is 100, then you would probably be ill advised to put your stop less than 100 points away from the entry price if you have a time horizon of, say, a week. You will quite likely get the position taken out by normal market price moves. Knowing the ATR is 100 won’t tempt you to have a stop just beyond a fairly obvious price level 60 points away. Hopefully lots of other people will go with the 60 points away choice, and if the stops get run (when the market moves in a certain way to take out trades at what is an obvious price level for a stop loss), then you’re still a little way from the price action.
We have to accept that markets over shorter time frames, and at certain price levels particularly, are more easily manipulated, and many elements involved in the market make money from volume. And what better way to create volume than fake-outs and running the stops? Then we’re really getting into game theory, which is something I think all traders and investors should study.
Comments (0)