Trading Gaps: The Sky Is The Limit
What is interesting about the chart gap – an area of untraded prices either day to day or intraday – is that it is still relatively underused and misunderstood, especially given relative importance. This idea stems from the way that gaps have a tendency to be reliable as both predictive charting features, and as decent money management points. A good example in the recent past has been the setup which can be seen on the Sky (SKY) daily chart. Here the gap to the upside seen in February was key for a couple of reasons.
The first was the way that it occurred through what was then the highs of the year to date. The second factor is that this gap remains unfilled. The big prize that technical analysts are looking for in momentum situations is when a gap is seen and then shortly after a new support point comes in after the gap. In this case there was not one, but two for March. That said, aggressive traders, and perhaps long in the tooth chartist like myself would have been happy to go long of Sky on the open of 24th February, the day after the unfilled gap was confirmed. The stop loss rule at that point would have been an end of day close back below the gap. This is a rule that I have found very useful over the years, and in the case of Sky it would have been enforceable only below the floor of the February feature at 947p. Therefore the simple “gap” trade was to go long at 972p and risking around 24p, a setup which most of us would find acceptable. This was particularly so given the way that even at that time the top of a rising trend channel from October gave us an implied target towards 1,100p.
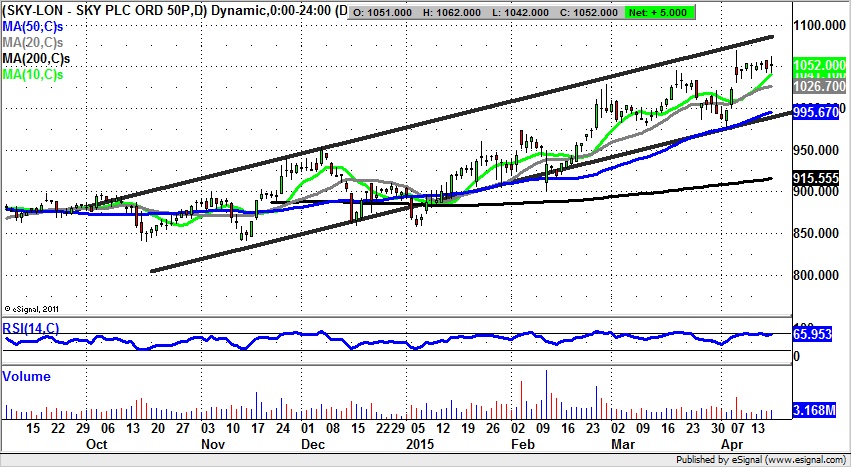
But as you might perhaps expect, there is more to the charting story and the gap trading approach than what I have discussed so far. It is said that rather like profit warnings and London Buses, gaps on stocks and markets tend to come in threes. This is because they are very often the result of traders being caught off guard, something which means that rather in the manner of a slow ticking timebomb, further gaps will be unleashed as they are forced to exit their (wrong) positions. This process has clearly panned out since February. The result is that April to date has delivered two unfilled gaps to the upside. Both could have been traded either as continuation signals on the original February gap or as new entry points. For instance, the initial April gap meant that one could have been going long on the open of the 8th at 1,047p with an end of day close stop loss at the gap floor of 997p – again a relatively tight money management position. Then we saw yet another gap higher on the 8th to give a 1,046p entry on the 9th to give an ultra tight 1,024p stop loss.
The position now is that while we are mindful of the rule of gaps coming in threes having run its course, the implied stop loss below the third gap remains active. And we are still awaiting the 1,100p zone target as high as 1,110p over the next 4-6 weeks. Therefore it is evident that one can use gaps almost on their own and have a relatively robust trading/investing strategy.
Comments (0)