The Old Wives’ Tales of Trading

Humans are always looking for patterns, especially where they don’t exist. Where it suits their preconceptions a sample size as small as one will do very well. Their pronouncement will usually be preceded by the four words that illustrate that they have no real proof or evidence for their claim at all: “all I know is…”
Old ladies deciding if they like the weatherman based on the kind of weather he appears to deliver, sports idiots wearing lucky garments and carrying our repetitive rituals, people touching statues and kissing stones.
On the other hand Einstein was wrong on this topic. He famously said “insanity is doing the same thing over and over and expecting different results”. Obviously he never traded stocks and shares! It also appears that quote has been misattributed to him in any case, and seems to have come from drug rehab pamphlets in the early ‘80s.
Being a technical trader I love patterns. Ones that are real that is. Ones that are based on years of results. There is a question in some quarters about whether one should go looking for a pattern. For instance, using TradeStation I can create charts based on any number of minutes in a day from 1 to 1,440. I can do the same with tick charts (where a tick is a single trade). If you scoured these timeframes all the time you could probably find more or less anything, but you do need context for a pattern to be valid. A head and shoulders on a 1 minute chart is not likely to be tradable if it works at all.
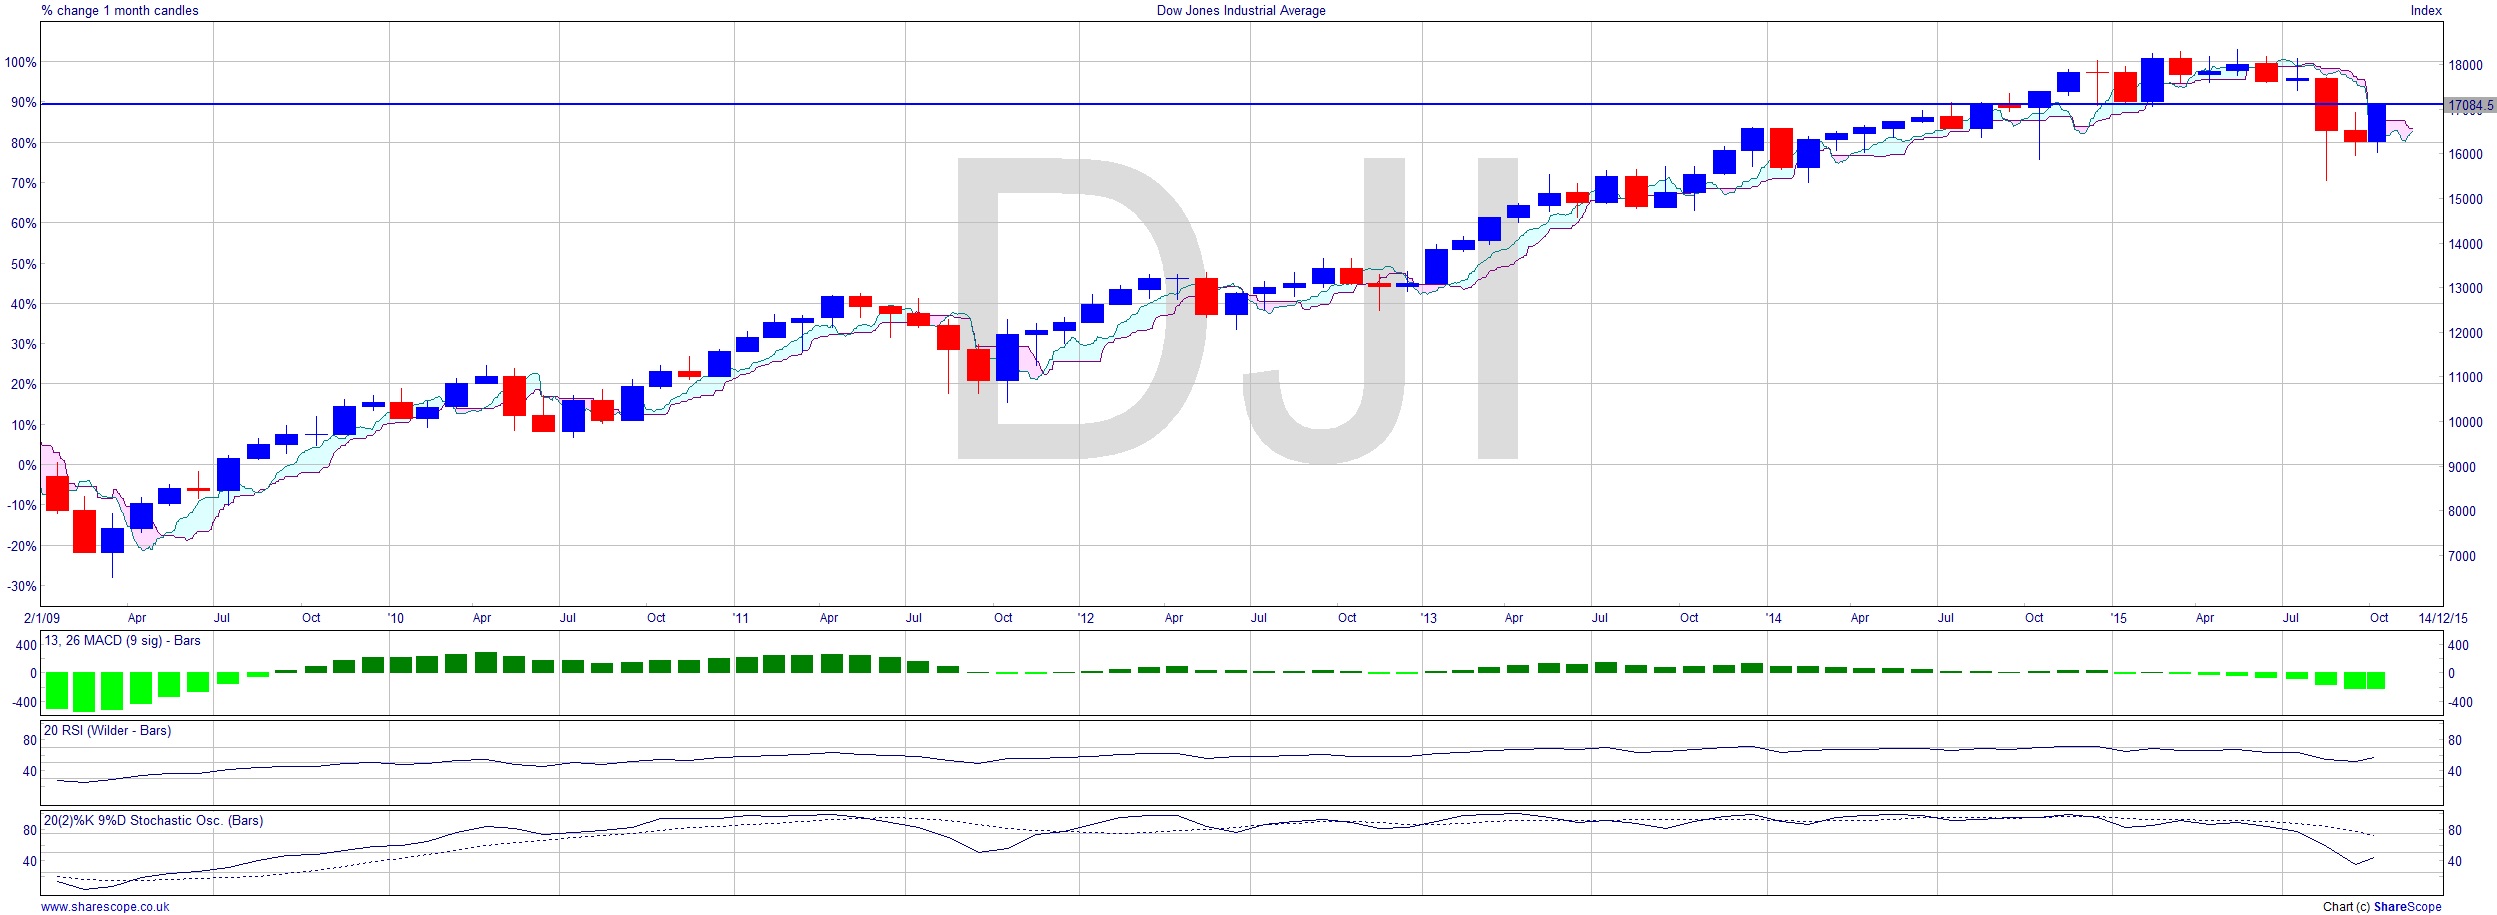
There are, however, lots of myths supposedly based on some sort of wisdom. Gaps closing on charts is one. It’s a popular one because a monkey could identify it, and there are some who would even say it’s an absolute: they always fill. They don’t, and there are plenty of examples of gaps not filling but instead racing off in the other direction on the Dow Jones Industrials Index alone. The most recent is from 2009.
Another is that the Chinese market always goes up in the early part of the year then trades off in the second half. Ok let’s examine that then. The Chinese are avid gamblers. And once that behaviour gets into asset classes they’re forever blowing bubbles. Let’s see how that trading strategy would have worked over the years since 2009.
Nice little earner in the first trade making 65%. The current trade is still live (short second half 2015) and that’s up 22% at the moment. Other than that it’s been largely swings and roundabouts. It also missed most of the massive swings of the last three halves (oh no! David Coleman’s been here). Ignoring the first and last trades then we would have seen an overall loss of around 10%. It would have been preferable to simply buy the Dow for the whole period and take a long holiday as that would have made you 90% with much less volatility (i.e. wear and tear to your nerves!) The China A Blue Chip Value 100 [XINBV] is presently up just 55% so the strategy has at least out-performed that, but only just. If we ignore the paper gains from the current trade then actually it’s under-performed the index – that’ll get you sacked at an investment bank!
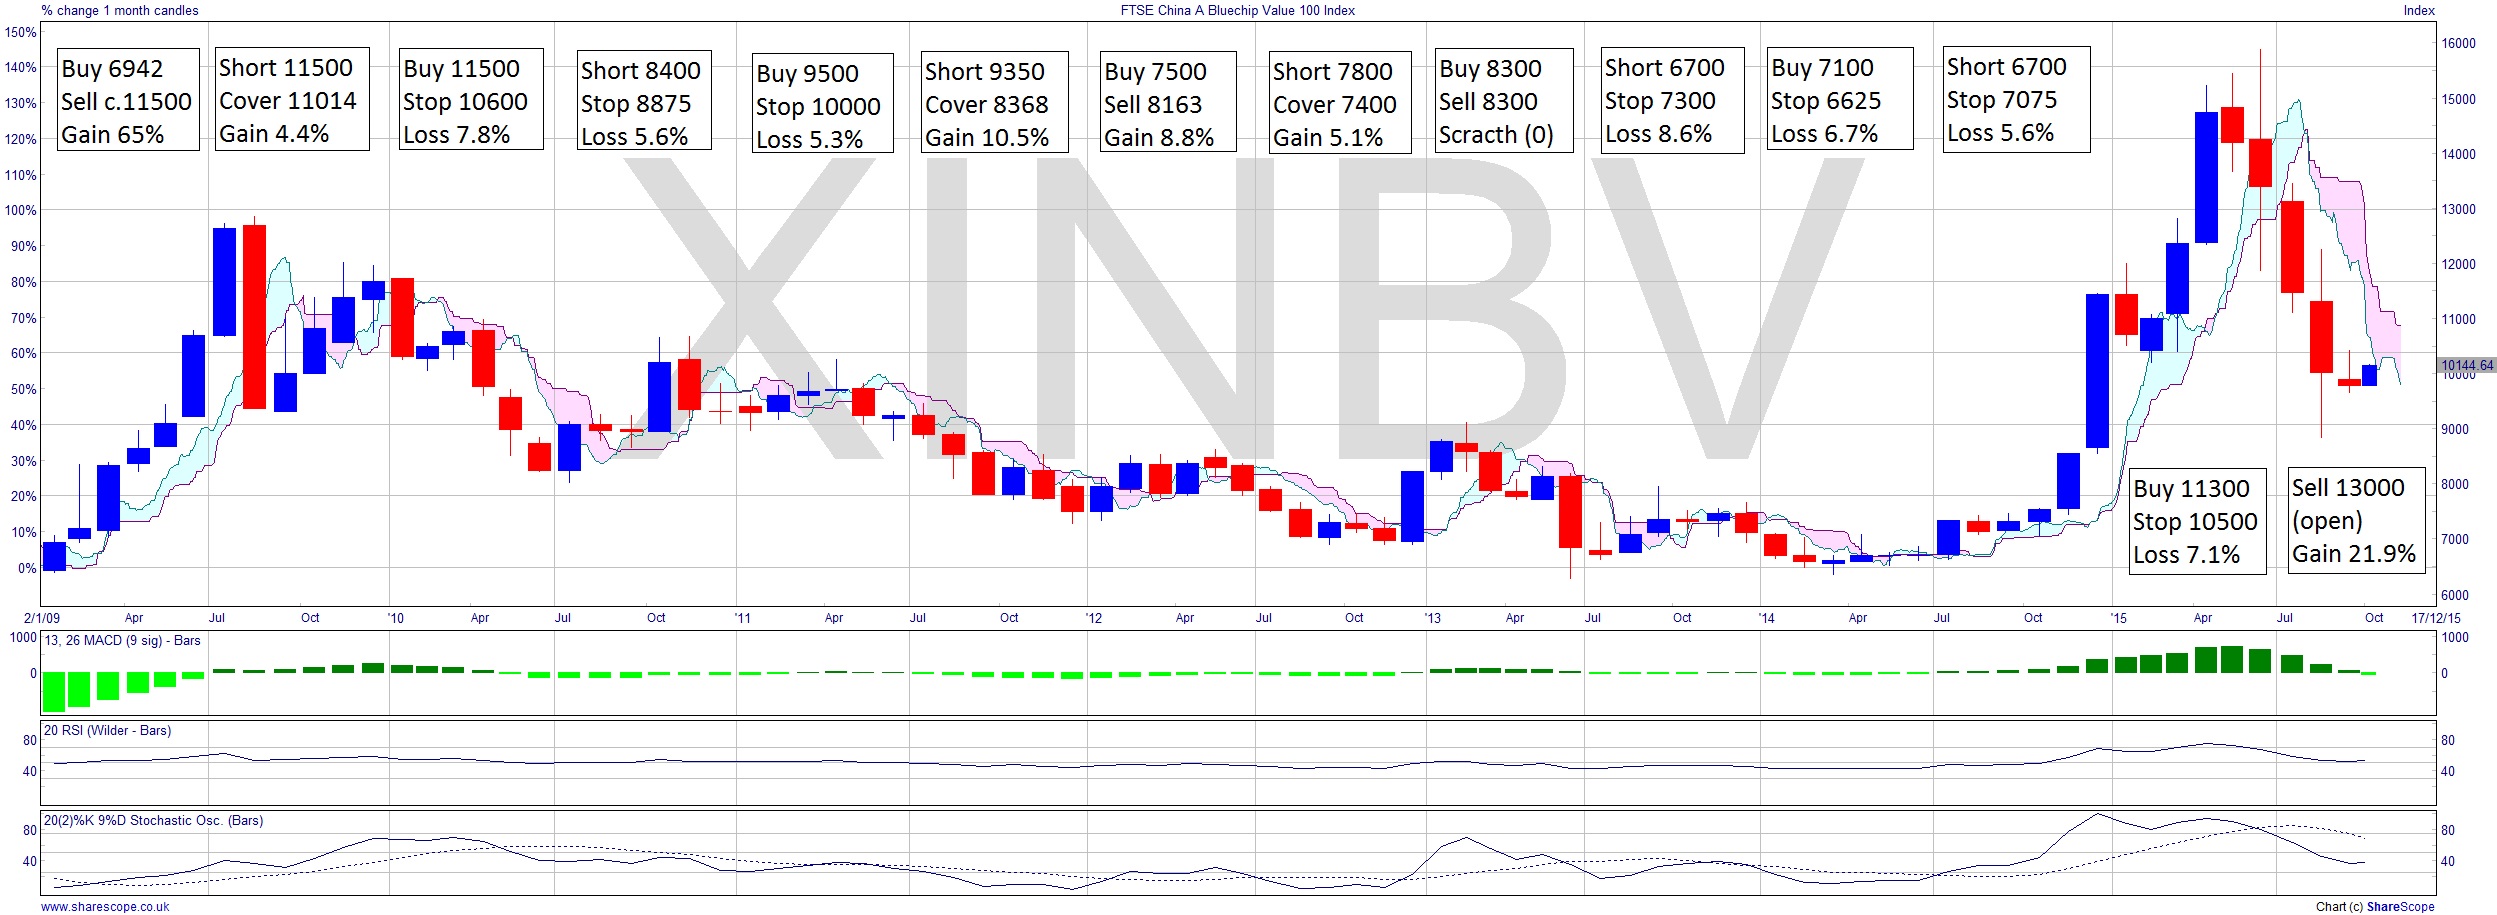
[Strategy notes: using the weekly chart, opening the position on the first bar of the half year at an easily filled price. Closing positions using a two bar strategy taking out the extreme of that bar – this takes some account of the prevailing volatility, in preference to a percentage. Gain banked: 46%, open position unbanked gain of 22%]
Comments (0)