TA: Spotting Differentials

Perhaps until the ‘80s it was possible to say that governments had some control over their own economic destiny, and particularly that of their principal stock exchange. It’s not true anymore, and broadly the global economy will ultimately influence everything. We can capitalise on this as traders/investors by spotting when markets start to converge or diverge.
You need a starting point where it can be argued that markets were in synch, and the obvious choice is the start of the current market cycle. Even though we’re a good few years away from 2009 now, that was the start of the bull market that we are still in, for the moment at least. To carry out the analysis I’ve used ShareScope here but you could use other packages, or you could even download the price histories from Yahoo and create these charts on Excel if you wish – in which case do watch out for the incongruent public holidays which will mess up your analysis otherwise.
I’ve looked at the CAC here. It’s certainly been an underperformer in a global sense. I’ve put the FTSE 100 in blue and Dow in green to show the relative performance. We know the FTSE 100 has been pretty awful over the last 6 years, but the CAC has been worse! That could be set to change. The CAC 40, unlike the FTSE 100, has tracked the Dow for the time that the FTSE 100 went sideways. On this monthly chart you can see that it’s breaking up above the cloud and looking pretty strong on the MACD too. The resistance level I’ve marked on is not the ATH. Far from it. You have to go back to 2000 for that. It’s not even close to the high in 2007, but it is a significant resistance level just now. It’s also relatively higher than the FTSE 100 has been in the current bull market.
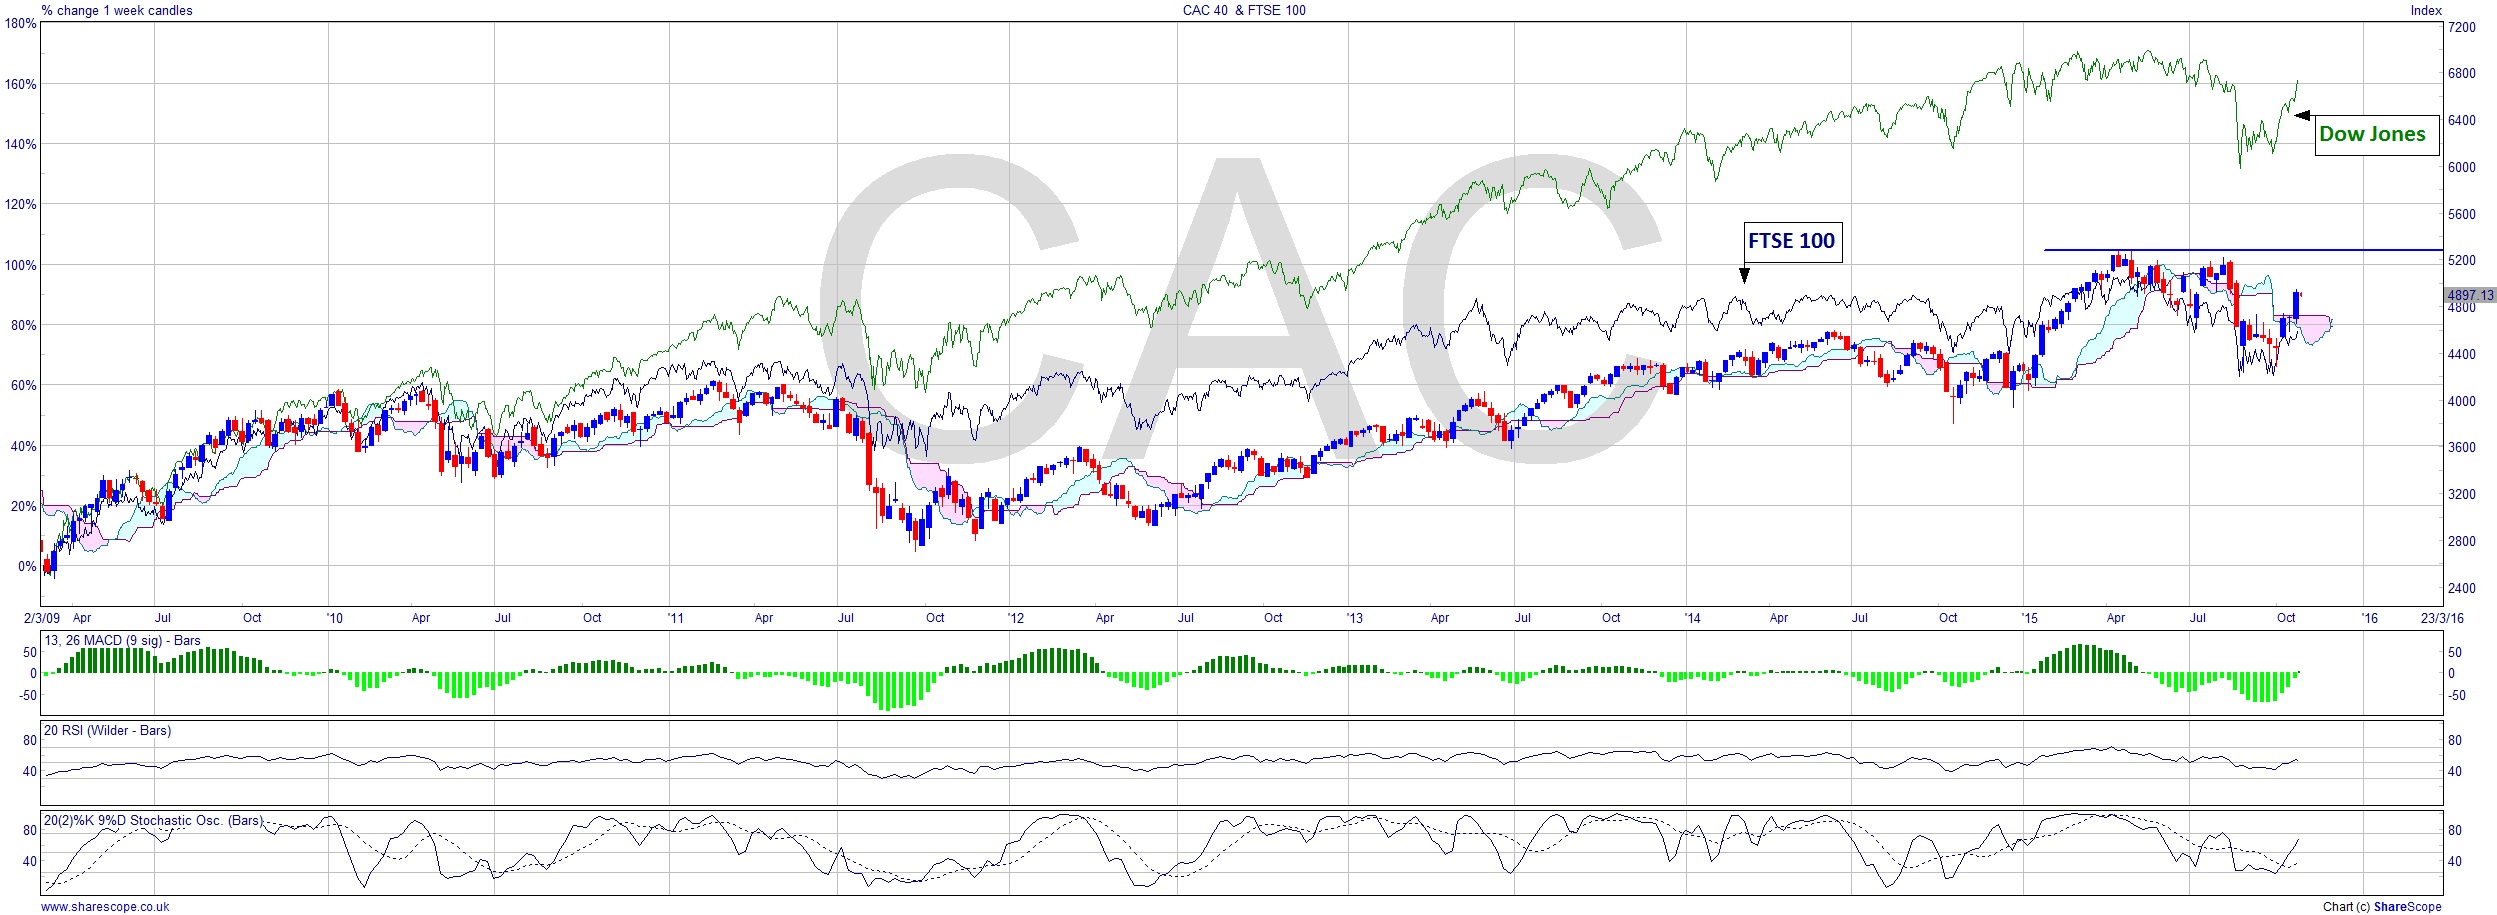
France has had a left-leaning government and they certainly have done some cockamamie things which did upset the markets, but ultimately global influence prevails (and that’s really a proxy for the Dow – or vice versa – these days), and it wouldn’t be unreasonable now to think that not only can the CAC 40 out-perform the FTSE 100, but may even catch up with the Dow.
The worry is that this bull market can’t last forever. So why expose yourself to that risk? The solution is simple. Trade the difference. Put on a hedged position where you have only the risk you want: the difference between then CAC 40 and the Dow Jones. Or perhaps you’d prefer the CAC 40 versus the FTSE 100. It’s not a weird trade at all. All currency pairs are hedge trades and they’re pretty basic animals.
So, subject to a suitable entry point you would go long the CAC and short whichever of the others you think it’s going to out-perform. Similarly, if you feel it won’t, then it’s the opposite. Trade sizing is a little too complicated to go into here, but that’s the basic trade idea. I can hear one question though. You might be thinking “Adrian, aren’t you suggesting a break-out trade and yet you said they are for pussies?” No. Because you’re not trading the index, you’re trading the difference between two indices. You may be entering at the same time as those who are trading the break-out if you choose the break above that price level for your entry, but it’s coincidental.
Comments (0)