Chart of the Day: Royal Dutch Shell

Royal Dutch Shell (RDSB): BG: Too Big to Swallow?
There were some siren voices who suggested that Royal Dutch Shell’s move on BG Group was akin to that of RBS going for ABN Amro just before the financial crisis. This was especially so on the basis that the deal was signed just before the painful decline for Crude Oil towards $25 from over $100 a couple of years back. However, there are a couple of differences between (Sir) Fred Goodwin’s faux pas and the move by Shell. This is primarily because it is one of the most cash rich oil companies around, and in BG Group it had picked on a company which had essentially gone as far as it could go without being a genuine multinational giant – or of course being snapped up by one. I have to confess that well before the move was tabled I was thinking that BG really needed to be put out of its misery as a go it alone play.
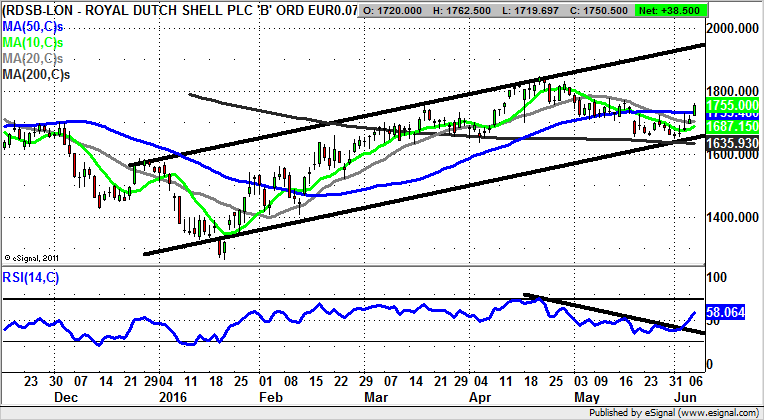
In fact, the charting position of Royal Dutch Shell illustrates quite well how the market has been attempting to digest not only BG / Shell, but also the decline and rebound for Crude Oil after the beginning of the year, and the China bear trap in January / February. But what can be said now at least, is that provided there is no end of day close back below the 200 day moving average at 1,635p the upside here should be as high as the December resistance line projection at 1,950p over the next 1-2 months.
Comments (0)