Rotten to the Glencore

Not altogether surprisingly, I read today in the FT that blue chip dividend cover is at a six year low. You may remember me writing in July that profit warnings had hit a six year high; well, this is the same news, just a little further along the food chain.
Apparently, many of these companies are maintaining dividends and I bet that’s because interest rates are artificially low. There’s not much pressure on companies to make sound decisions when they can borrow their way out of bad ones for next to nothing. In fact they can window dress a whole company-failure with cheap money because it’s easier to borrow money than it is to do business.
It’s created a climate of over-confidence and arrogance that has led us to the basically victimless crime of VW and others faking emissions tests, and Glencore (GLEN) getting themselves in trouble. They’re making decisions based on easy lending and wrongly assuming a status quo exists in this climate. Actually, they should be more hard-nosed than ever because once rates do rise they are going to the wall if they’re not, unless they are very lucky indeed.
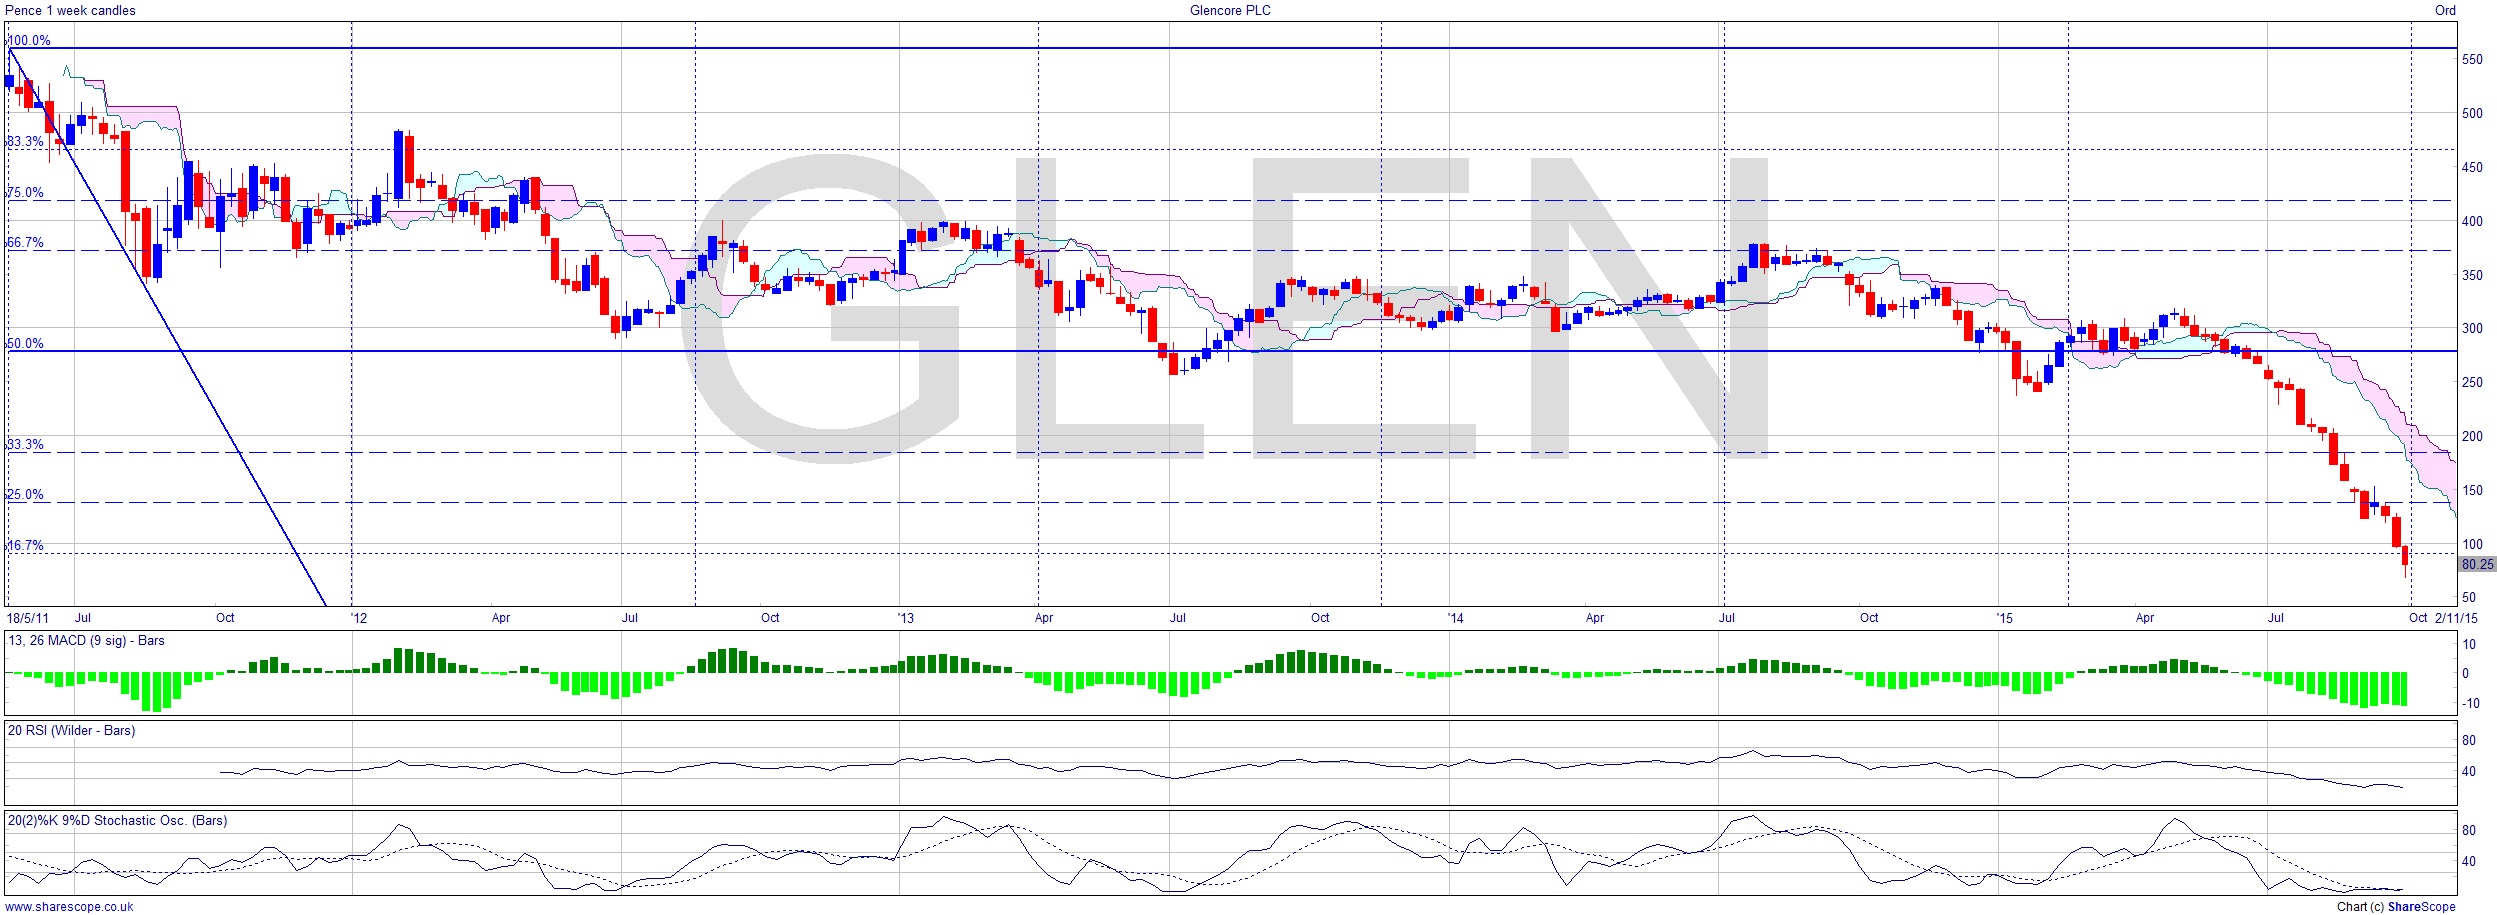
Glencore’s chart is at the point now where I’d be very wary of shorting it. Especially as a technical investor/trader, I don’t want to spend hours (days even) analysing the true worth of the company in an attempt to estimate take-over value. That’s fine for an investment bank with resources to do so but as private investors, unless you really like the challenge it’s a poor use of our time.
I don’t like the oft used analogy of catching a falling knife when talking about trying to spot the turnaround after a price crash. There are plenty of tools and signals which, when used correctly, make it more like catching a tennis ball. It’s hard to anticipate, and there are usually false signals which put off the over-eager, but patience and lack of emotion pay dividends in technical trading.
So what do we know about Glencore from the chart?
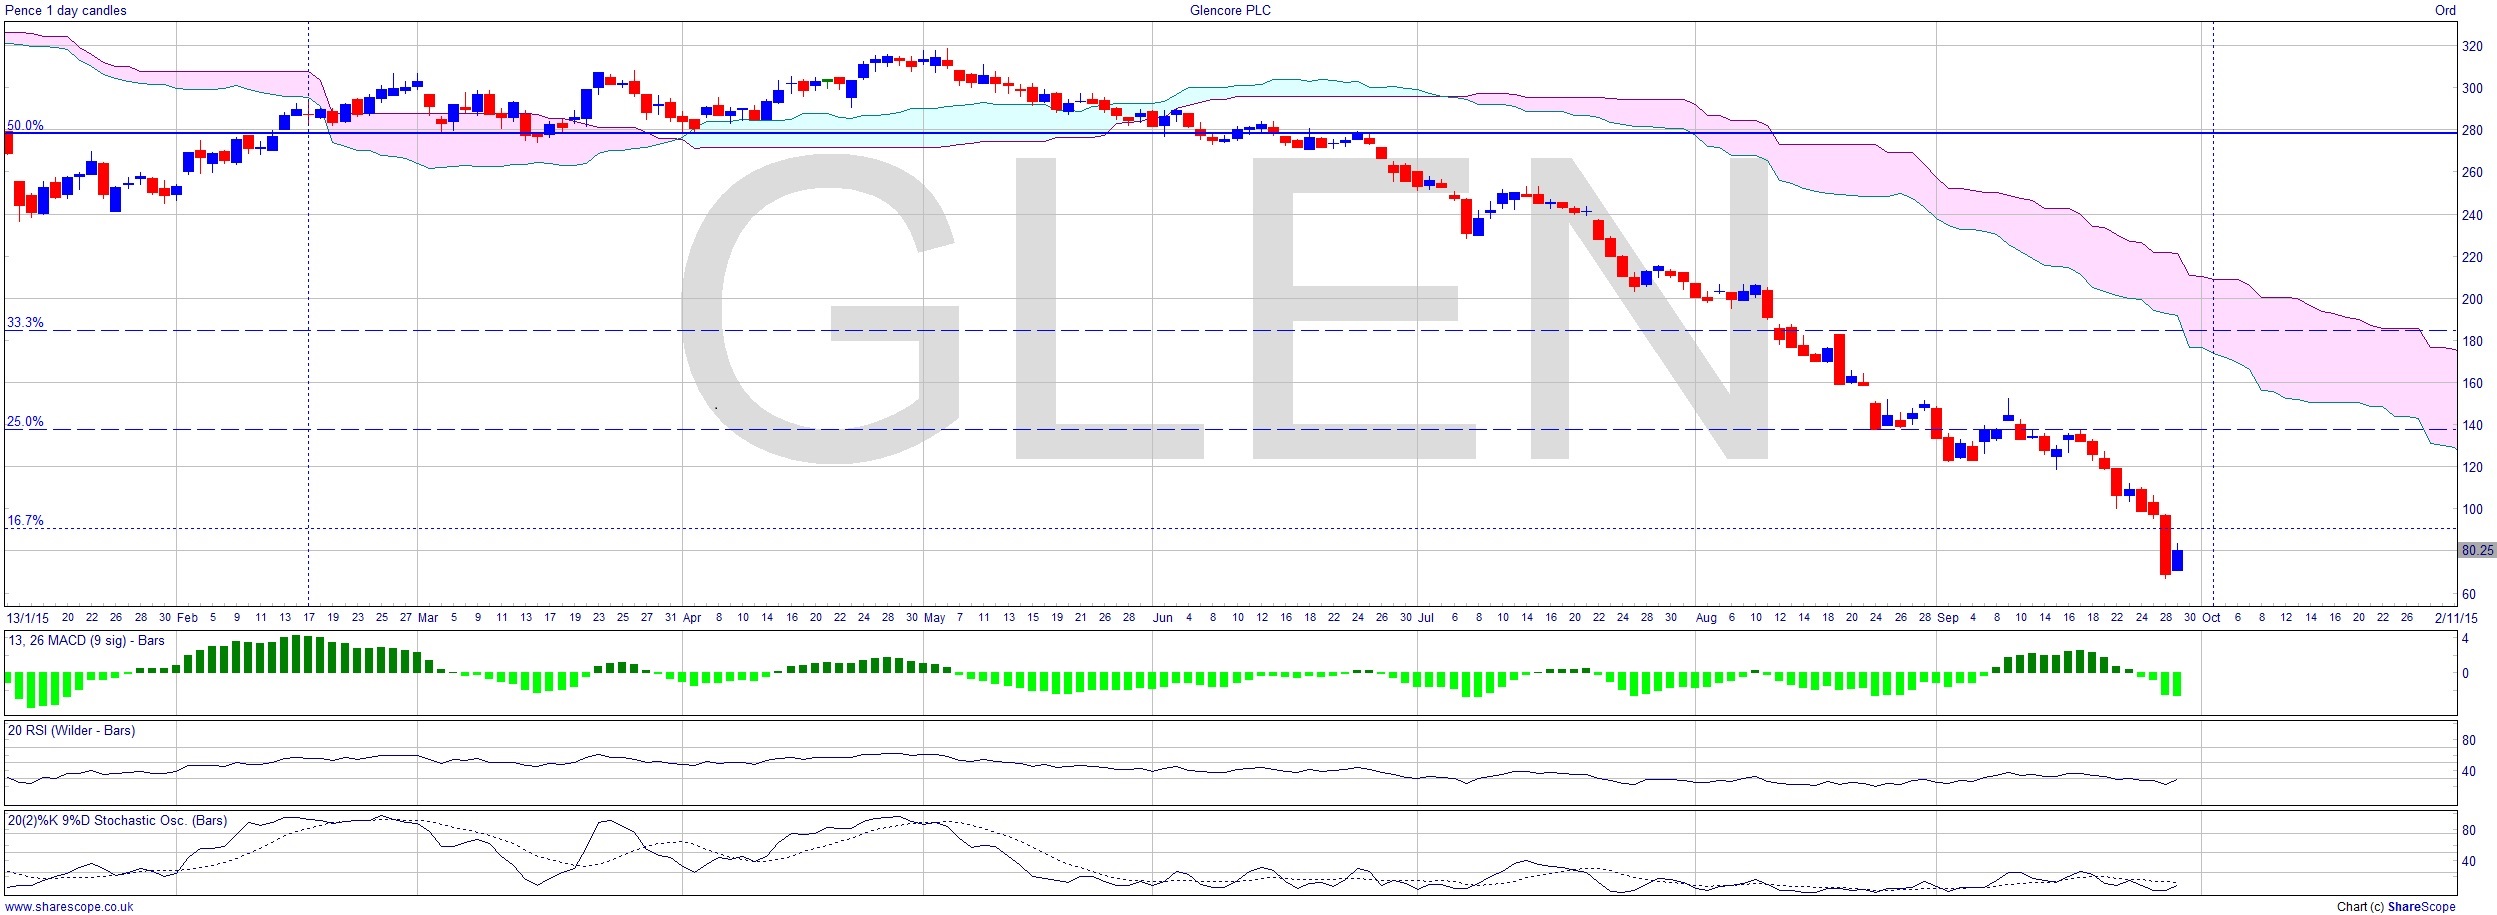
Well, for a start we can say the price has failed at significant levels, like the 50% level from the high at the beginning of the chart (this chart is from Sharescope and includes the full price history of the current listing). It’s been as low as 10% of the ATH. That’s where you start to get interested in the recovery. Ok we’ve seen a bit of a bounce there. This is the weekly chart and we’re still well below the Ichimoku cloud. I’d be looking at the daily chart to see a positive signal and then looking for a reinforcement of that which should then translate into a positive signal on the weekly chart. Surely there must be some suitors for the company. All they really have to do is agree the dowry with the creditors, i.e. get the banks to agree refinancing, and you’ve got a merger on your hands.
As we stand the daily is offering no confidence at all. Maybe it’s going to fall to 6p not 66p before we get that signal, but it’s definitely one to watch if you like a recovery trade, or chasing the M&A tornados.
Comments (0)