Oil Majors Sweep: Bp, Royal Dutch Shell, Tullow Oil
Few would disagree with the idea that the stock market is a place where by definition we are kept guessing. Of course, speculation is a rather more upmarket version of the guessing concept. But it has to be admitted that for most of the market there has been quite a struggle to come to terms with the price of crude oil and oil and gas stocks since the massive decline of the autumn. No doubt, the conundrum will continue for much of what is left of 2015.
Clearly the issue is whether below $50 a barrel the underlying commodity has found a floor and hence will allow the likes of BP, Royal Dutch Shell, and Tullow Oil to see their share prices recover in a meaningful way. Certainly, it would appear that as we go into Q2 2015, the prospect of the UK stock market hitting the 7000 zone anytime soon will be dependent on the oil sector in particular and resources plays as a whole. As can be seen from the current charting positions of the FTSE 350’s largest oilers, the best we can say at this point is that we are looking at a mixed bag.
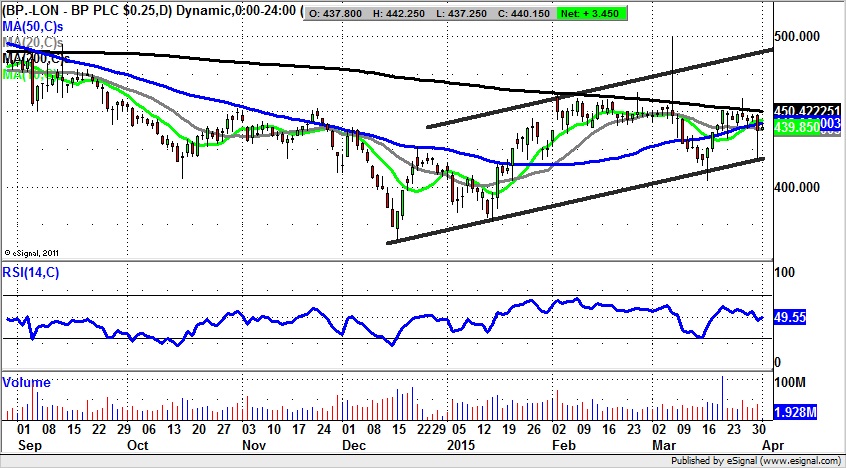
Taking BP (BP.) first, it is difficult not to be distracted by the ongoing aftermath of the Gulf of Mexico spill all those years ago. However, most would recognise that the bad news here is largely in the price, something that gives us the impression from the daily chart that things may be on the mend. In the near-term we are able to draw a trendline from December, with the good news here being the way that yesterday delivered quite a powerful hammer candle and returned the RSI back up to the neutral 50 level. This would suggest that we could still see progress within a rising trend channel from the end of the year. The best case scenario at the moment is probably that while there is no end of day close back below the £4.20 level, a destination as high as £4.90 at the 2014 resistance line projection may be on the cards. Only cautious traders would wait on end of day close back above the 200 day moving average at 450p before taking the plunge on the long side.
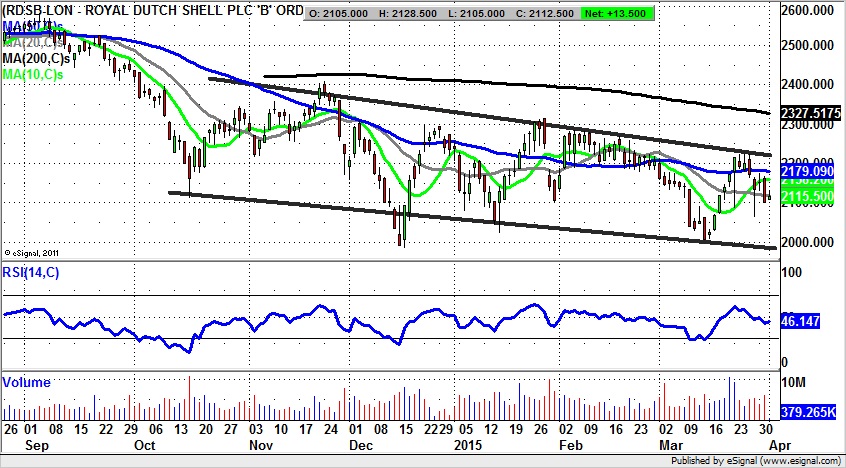
Although Royal Dutch Shell (RDSB) is lucky enough to have been allowed to restart exploration in Alaska, the current charting position does not seem to reflect this latest lucky break for the oil giant. Indeed we see the shares dithering towards the floor of a falling trend channel in place since October. While this feature is only descending in a mild fashion, the risk is that at least while below the 10 day moving average at £21.58 there could be a final test of support for the channel at £20 over the next 2 to 4 weeks. Indeed, it may be that after the slow declines since the autumn most traders would want to see a break of a top of the channel at £22 plus before considering going long of Royal Dutch Shell again.
Finally, we have the charting position of Tullow Oil (TLW), where there is also a descending price channel in place. Unlike Royal Dutch Shell the declines within this feature have been aggressive. The problem is that even after all the losses the risk here is that while there is no break back above the 20 day moving average currently at £3.11 we could see a final selling climax for the stock. The fear is while below the 20 day line the 2014 price channel floor target here could be as low as £2.50 over the next 2 to 4 weeks.
Comments (0)