Markets Update

The main markets just now are a bit like watching paint dry. So when thinking about them my mind drifts onto other things like: if The Great Pottery Throwdown is a clay based version of The Apprentice, will they have a post mortem for each eliminated candidate called You’ve Been Fired?
The FTSE 100 continues to show weakness and we might be about to see some action. Nothing much of significance usually happens as volume thins and the Festive Season is upon us. January is a more realistic time to expect action.
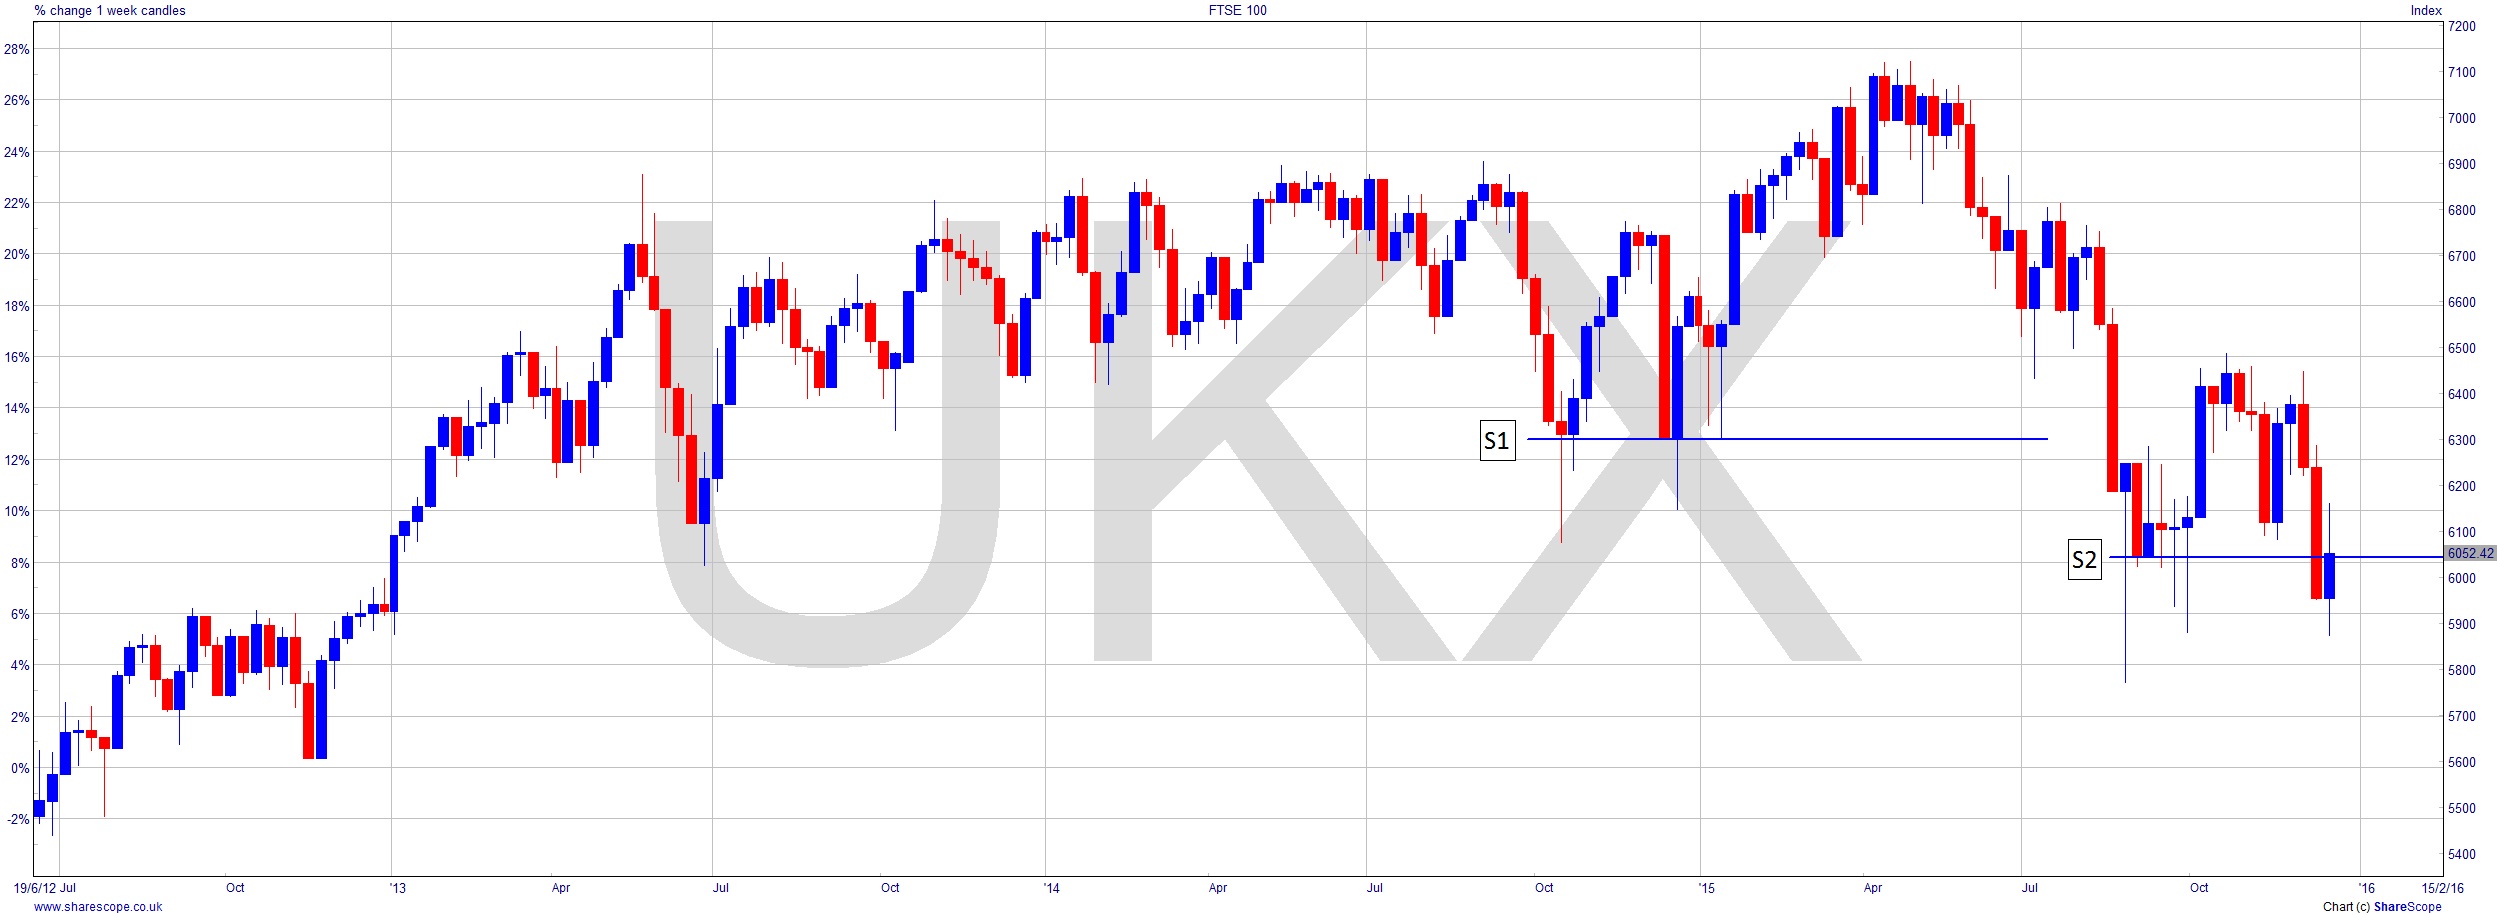
An interesting feature of Candlestick charts is that you can see very clearly where the tails are, i.e. the bit above the open and below the close. How important an opening price is can be debated, but the closing price is certainly significant. Equally so the lows in a Bull Market. I’ve marked on a couple of times where the tails are helpful indicators. The support level I’ve marked ‘S1’ proves to be much more useful than trying to pick out the lows of the candle tails. Not only does the level prove to be significant as support but then becomes support for the next rally up. And at ‘S2’ we can see that the real body is now telling us the index has again broken down.
I much prefer Candlesticks to other bar charts precisely because they give more information in the same space than other presentation styles. So we’re still seeing lower highs and new lows on the FTSE 100. And the UK will find some investment drifting away unless the interest rates here rise as they already have in America. Right now the US markets have just sweetened the pot.
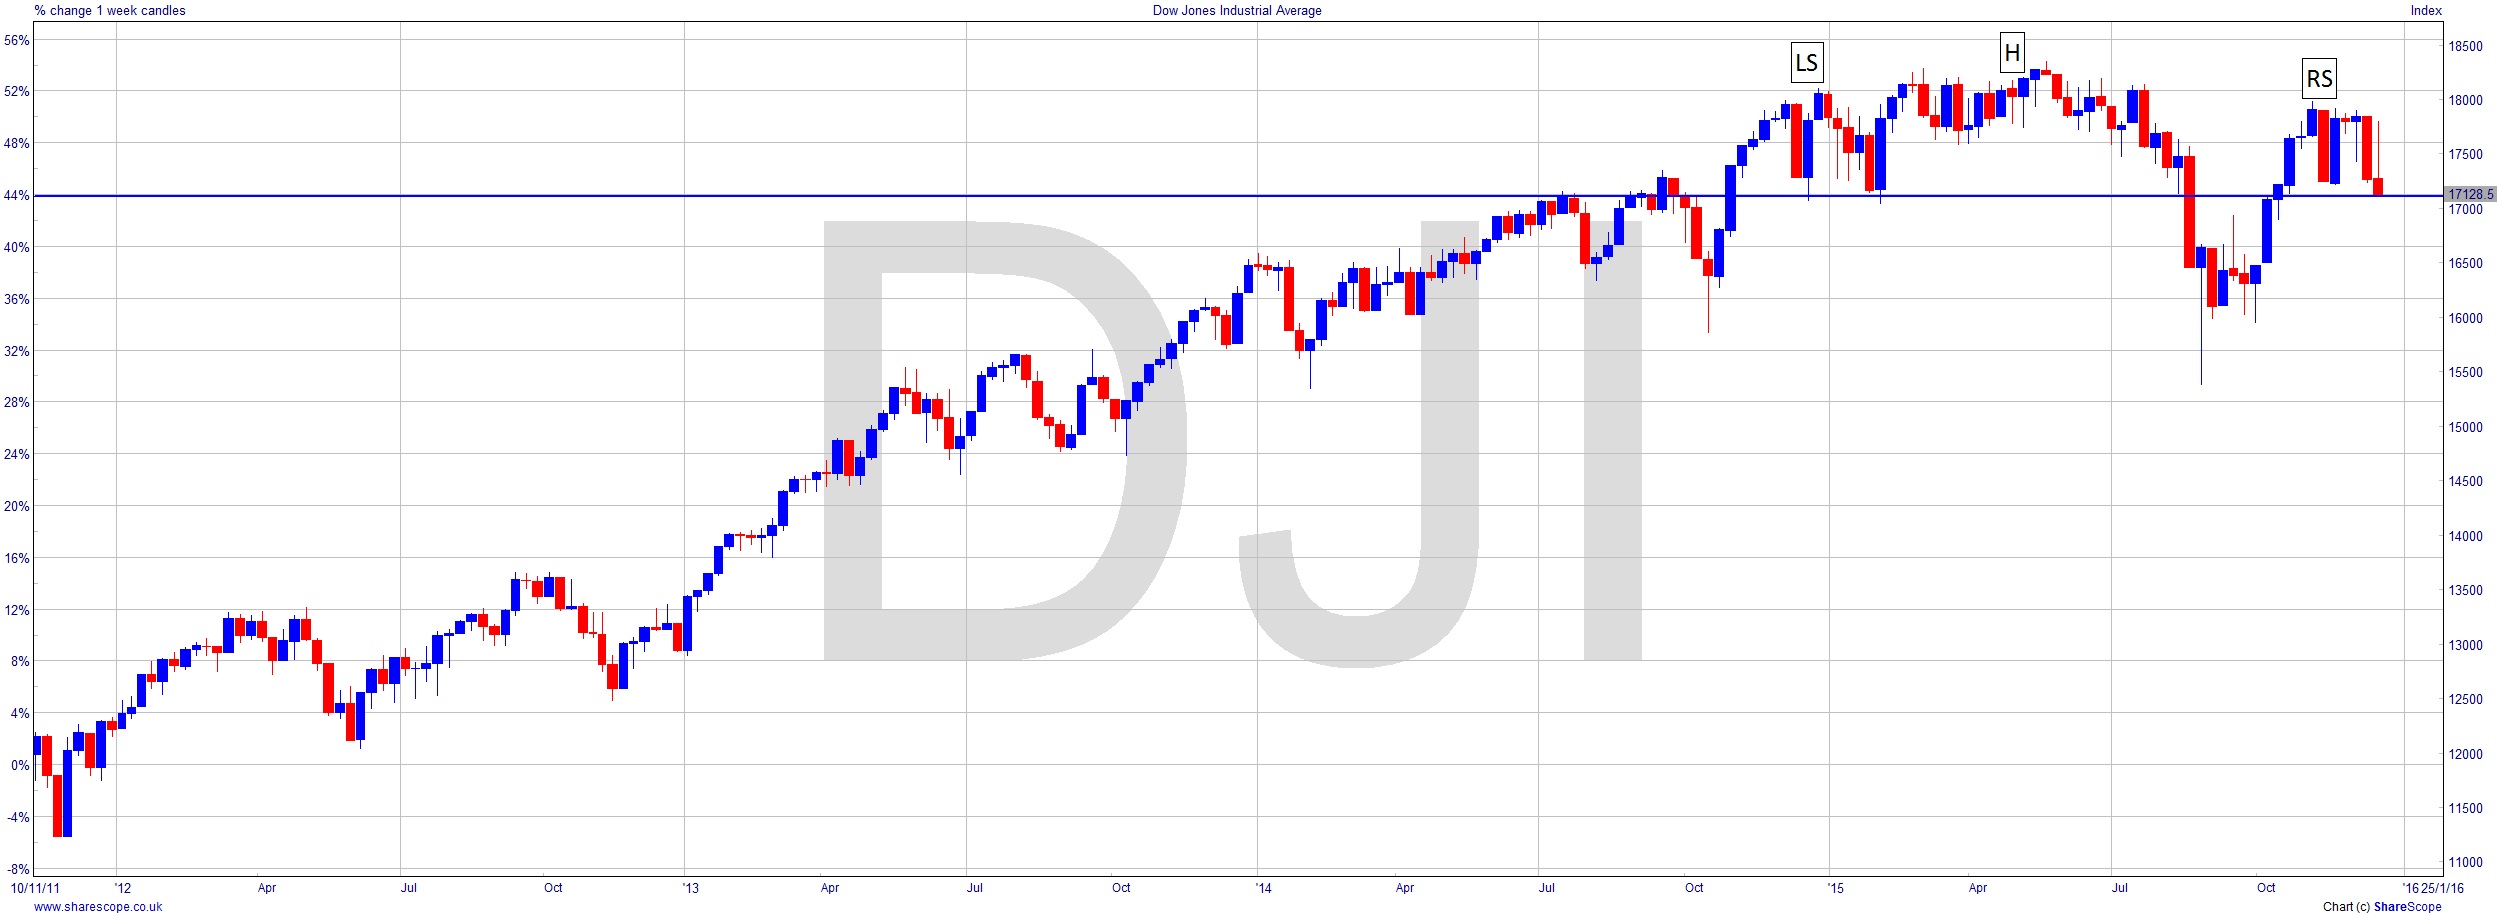
So what about the US markets then? Well that looks encouragingly like a Head and Shoulders there on the Dow. This could be the correction that the markets seem to be talking themselves into. What is interesting here is that if we do see a move down and recovery, say down to between 15,000 and 16,000, and then a recovery to around 17,000, then a much larger and more significant Head and Shoulders will have formed auguring a much bigger fall, and what would certainly then be a bear market. That said, the Yanks are pretty good at heading off disasters in the markets, and historically the years with Presidential elections are ‘up’ years for US markets at least.
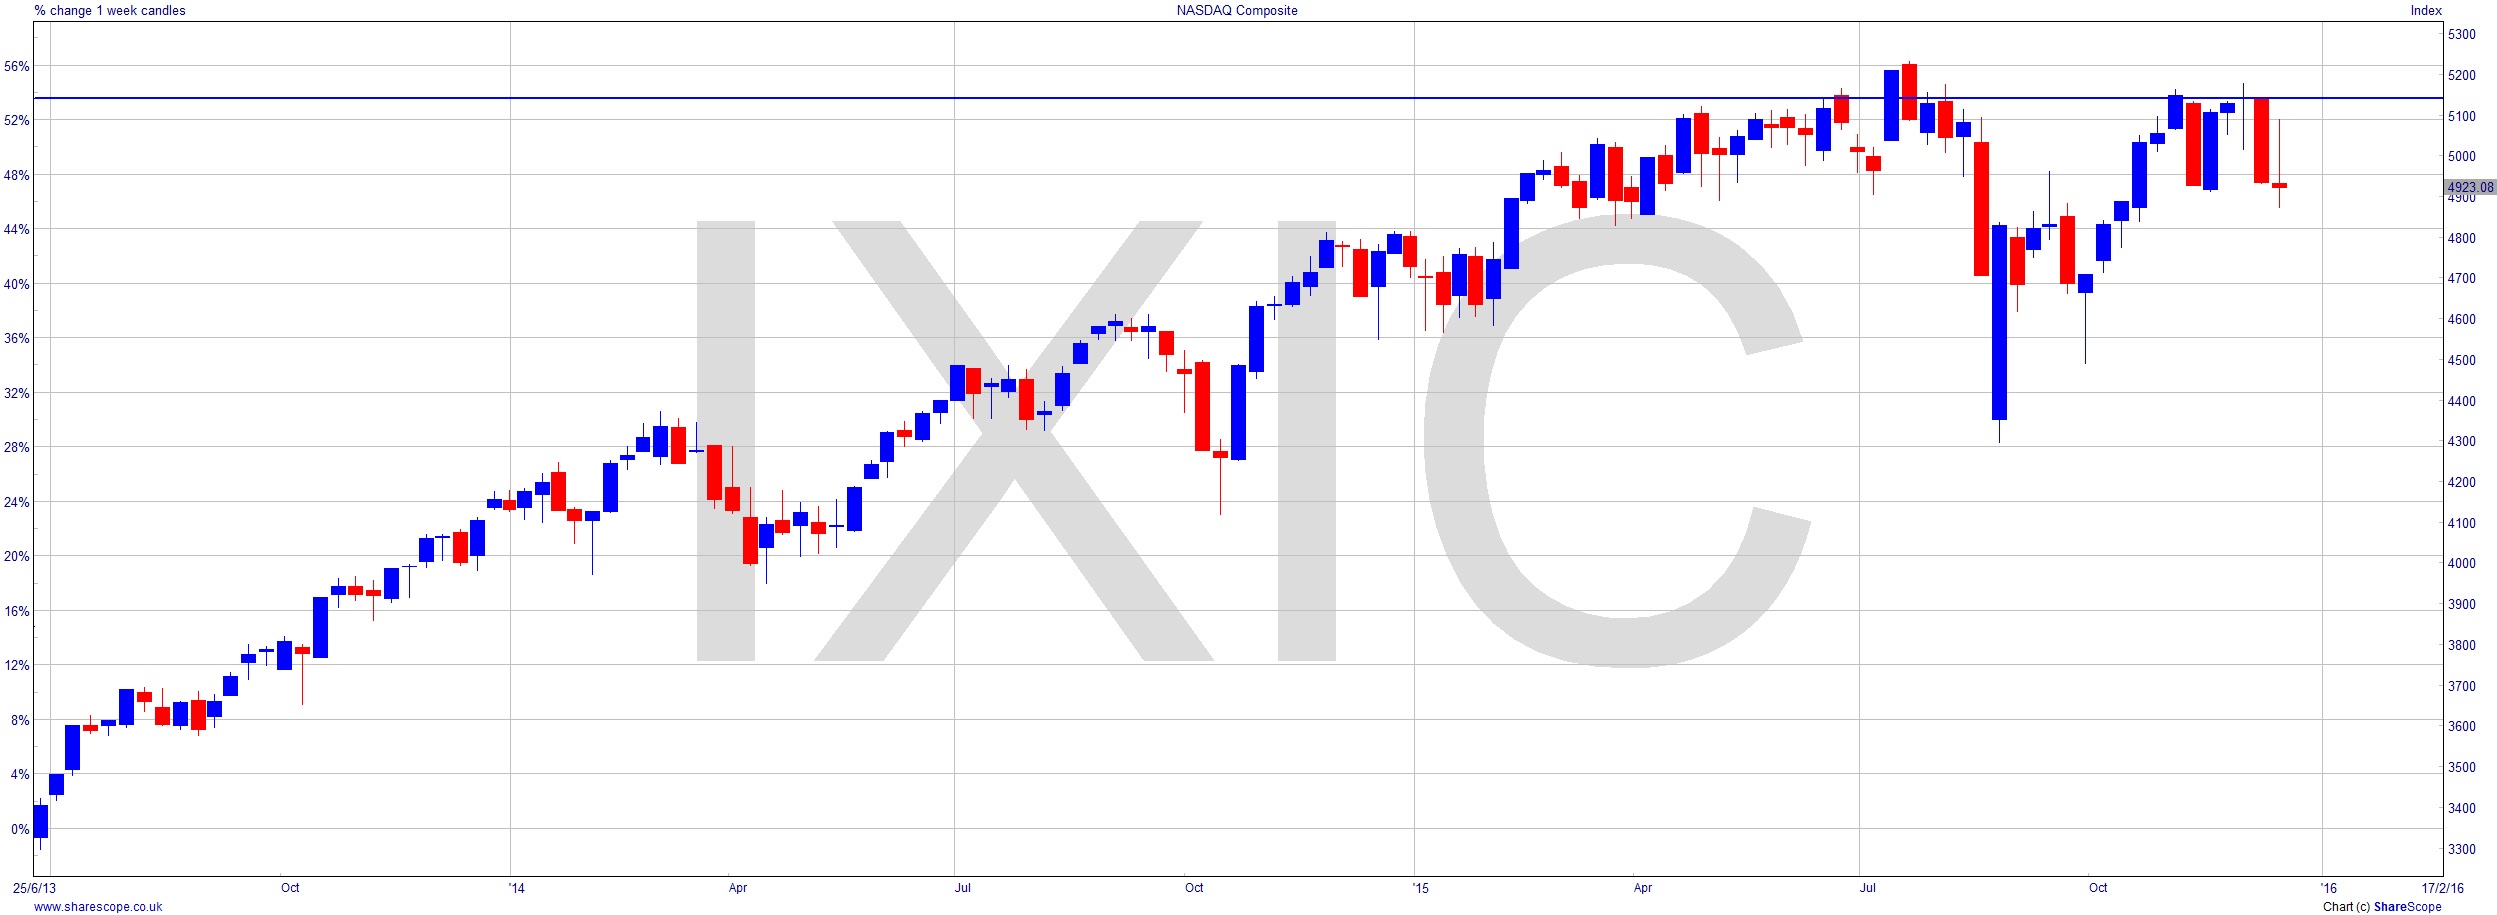
The leading index in the US is usually the NASDAQ, not least as many of the constituents are Tech companies. In other words, their value is based on hot air and speculation rather than capital value. This makes them the first to rise and the first to fall. The NASDAQ is failing at the 5,000 level, as it has been on and off for most of the year. This is the one we should watch. Any real sign of weakness here would be important. However we’re actually seeing a pretty solid performance.
I suspect we’ll soon witness some carnage in terms of corporate failures now interest rates are starting to rise. All those companies that got away with it over the last 6 or 7 years by solving problems through borrowing at very low rates, to maintain dividends or whatever, will now be caught out. I suspect this time next year we’ll have seen a few casualties. What we can hope for is the clear opportunity to short them, and for any rescue package to be off-market, and after the fact, rather than M&A, which is the Shorter’s enemy.
Comments (0)