Aggressive Trades – Low-Risk Trade Management (Part 3)
")
Over the last two posts I’ve focussed on how entering and exiting/managing trades is the part of the trade that’s most fraught with danger. I compared it to take-off and landing in an aeroplane, which is when most aircraft accidents happen. In the first part I looked at entering trades and in the second about managing and exiting trades. So here’s an example of how a trade might have been entered and managed using that approach.
There are literally thousands of stocks and other things we can trade these days, all from the one platform. I’ve used the company I picked for the entering a trade example, Daejan Holdings plc (DJAN). It’s not the perfect chart but there are opportunities, and it’s a fair example. I’m going to look at trading it in a manner some might call quite aggressively, but with a strong handle on risk. It’s a weekly chart so in real life you’d have plenty of time to make these decisions.
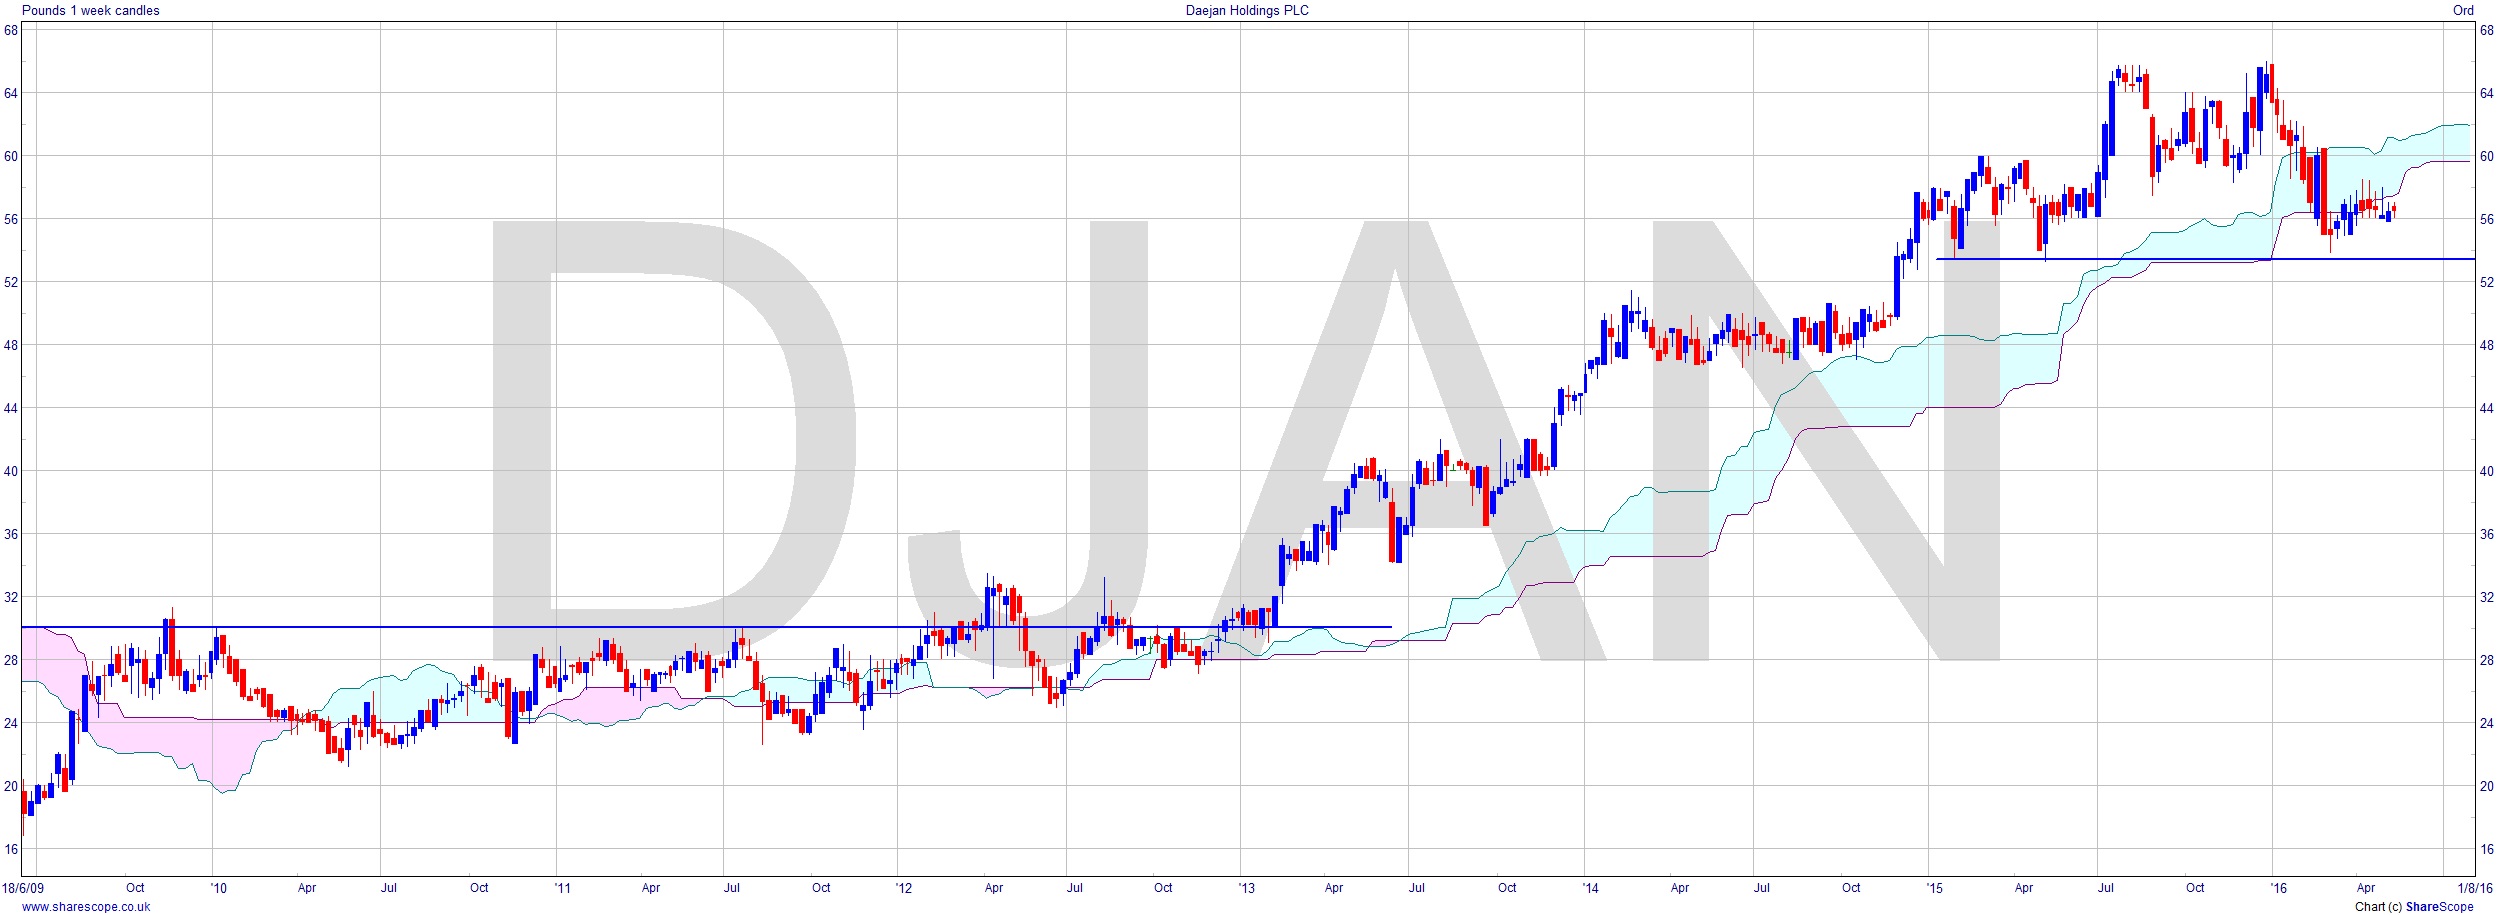
The chart shows right back to just after the crash. We see a recovery to around £30. This proves to be an important resistance level over the next few years. The share performance over this time is really lacklustre and pretty much a congestion area. In early 2012 we see a failed breakout and that’s really a precursor to the first trading opportunity. Failed breakouts are usually quite spectacular and this one falls 22% from around £32 to £25. However, there is huge volatility, which makes an entry too risky. In the zoom chart you can see the huge candle. The red candles that follow are unhelpful in terms of entry, again on the large side.
What happens next is where we can make an entry. The MACD is turning upwards, and the stock is obviously oversold at this point having fallen over 20% in just a few weeks. The candles are getting smaller – i.e. there is less volatility. We’re interested here because we have found support at the Ichimoku cloud. The cloud is a function of previous high and low turning points – in other words likely support and resistance levels. So if we’re seeing support at around £26 it is highly likely we’re still in the congestion area and, as you can see on the chart, we have seen a series of higher lows. So we’re not seeing overall weakness. The failed breakout will have made the resistance level weaker so it’s reasonable to go long hoping to at least reach the resistance level at £30. We have to be a bit careful here so probably a half position is the way to go. So we enter on the candle as shown. Let’s say we get filled £27.50 (we’d have probably achieved a much better price). As it breaks out we’re quite happy as we’re £3 up. By the next week the break out doesn’t take off so we can probably be sure here that it’s failed. However, we have easily been able to move our stop to at least breakeven, so what do we care? We’ve bought the luxury of time.
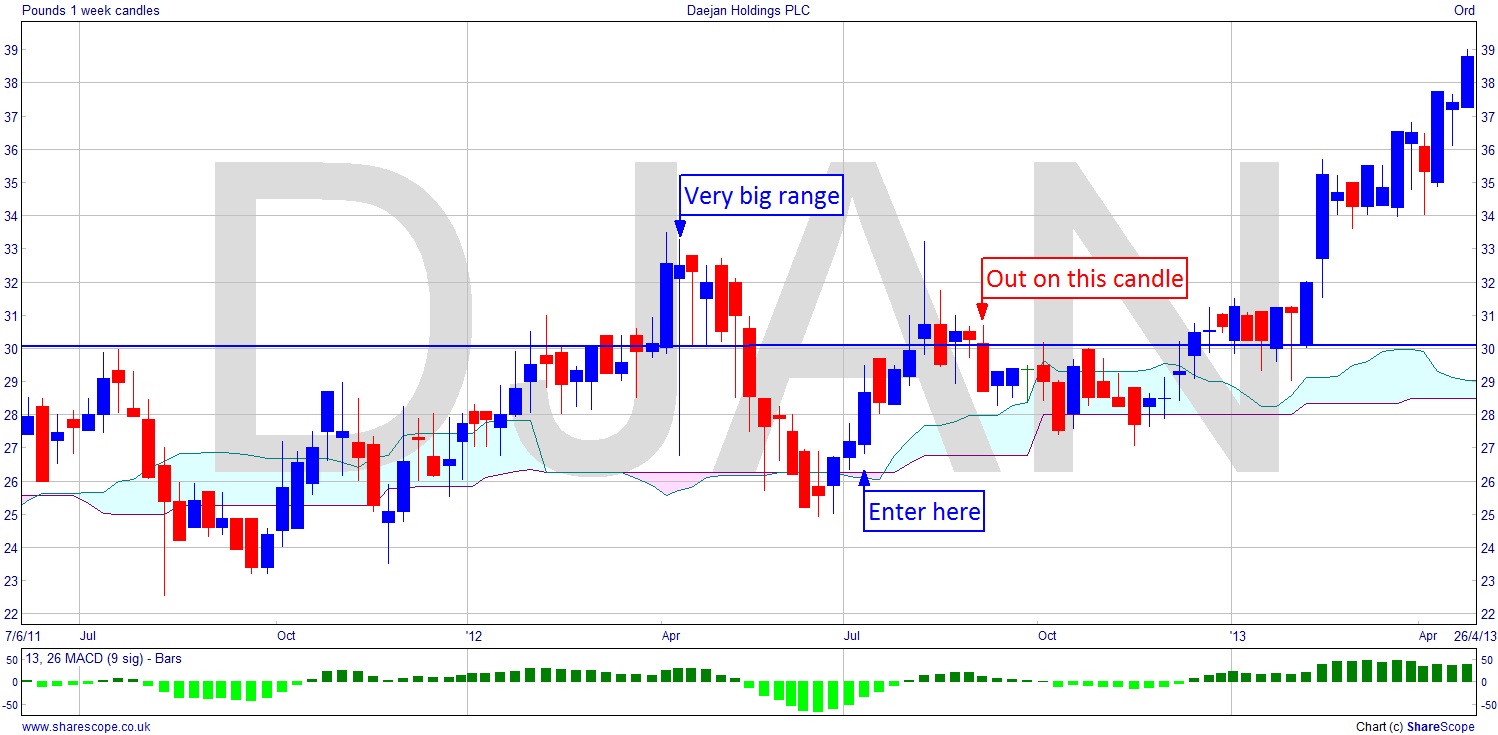
I’ve marked the candle where we certainly know it’s failed. No need to wait for the stop loss to get hit, we bank a small profit at around £29. So we’ve had very little risk and we’ve banked a profit. Managing risk like this is a boon to trading, using one position to springboard into the next. If we had waited for the breakout we’d have either made no money by not entering, or made a loss by taking the breakout trade.
Another way to manage this trade would be to make use of our low entry price and set our stop notionally at the cloud. Although the price falls out a bit it doesn’t open below the cloud. So if we kept our stop at breakeven it may even have been possible to stay in the trade depending on what entry price we had achieved. I’ll continue with the chart in another post.
Comments (0)