Cold Shoulder from the Main Markets

Over recent weeks I’ve been writing about the main markets showing weakness, and that persists. Obviously we saw a fall a few weeks ago, and it’s no secret that I’m expecting to see much bigger falls over the next six months. By and large markets ultimately fall (or rise), not because of actual reality, but because of the interpretation of that reality. It is confidence that makes markets rise and a lack of confidence that makes them fall.
Everything to do with trading is based on confidence – at the root of it, confidence in paper currencies. The dollar should have crumbled in recent years but hasn’t, because, it being the reserve currency, it’s too big to fail. Times are changing though and other currencies, particularly in places like China, are new pretenders to the throne. And when confidence ebbs away it is not usually a gradual thing, but suddenly reaches a tipping point. It’s possible that in different quarters there’ll be different levels of confidence and then there’s a domino effect.
Most major markets have now completed, or are completing, the second shoulder on the Head and Shoulders that will seal the fate of the markets. The easiest way to spot H+S patterns, by the way, is on a Point + Figure chart. It cuts out the ‘noise’ of time and, a bit like a swing chart, gives you the significant points.
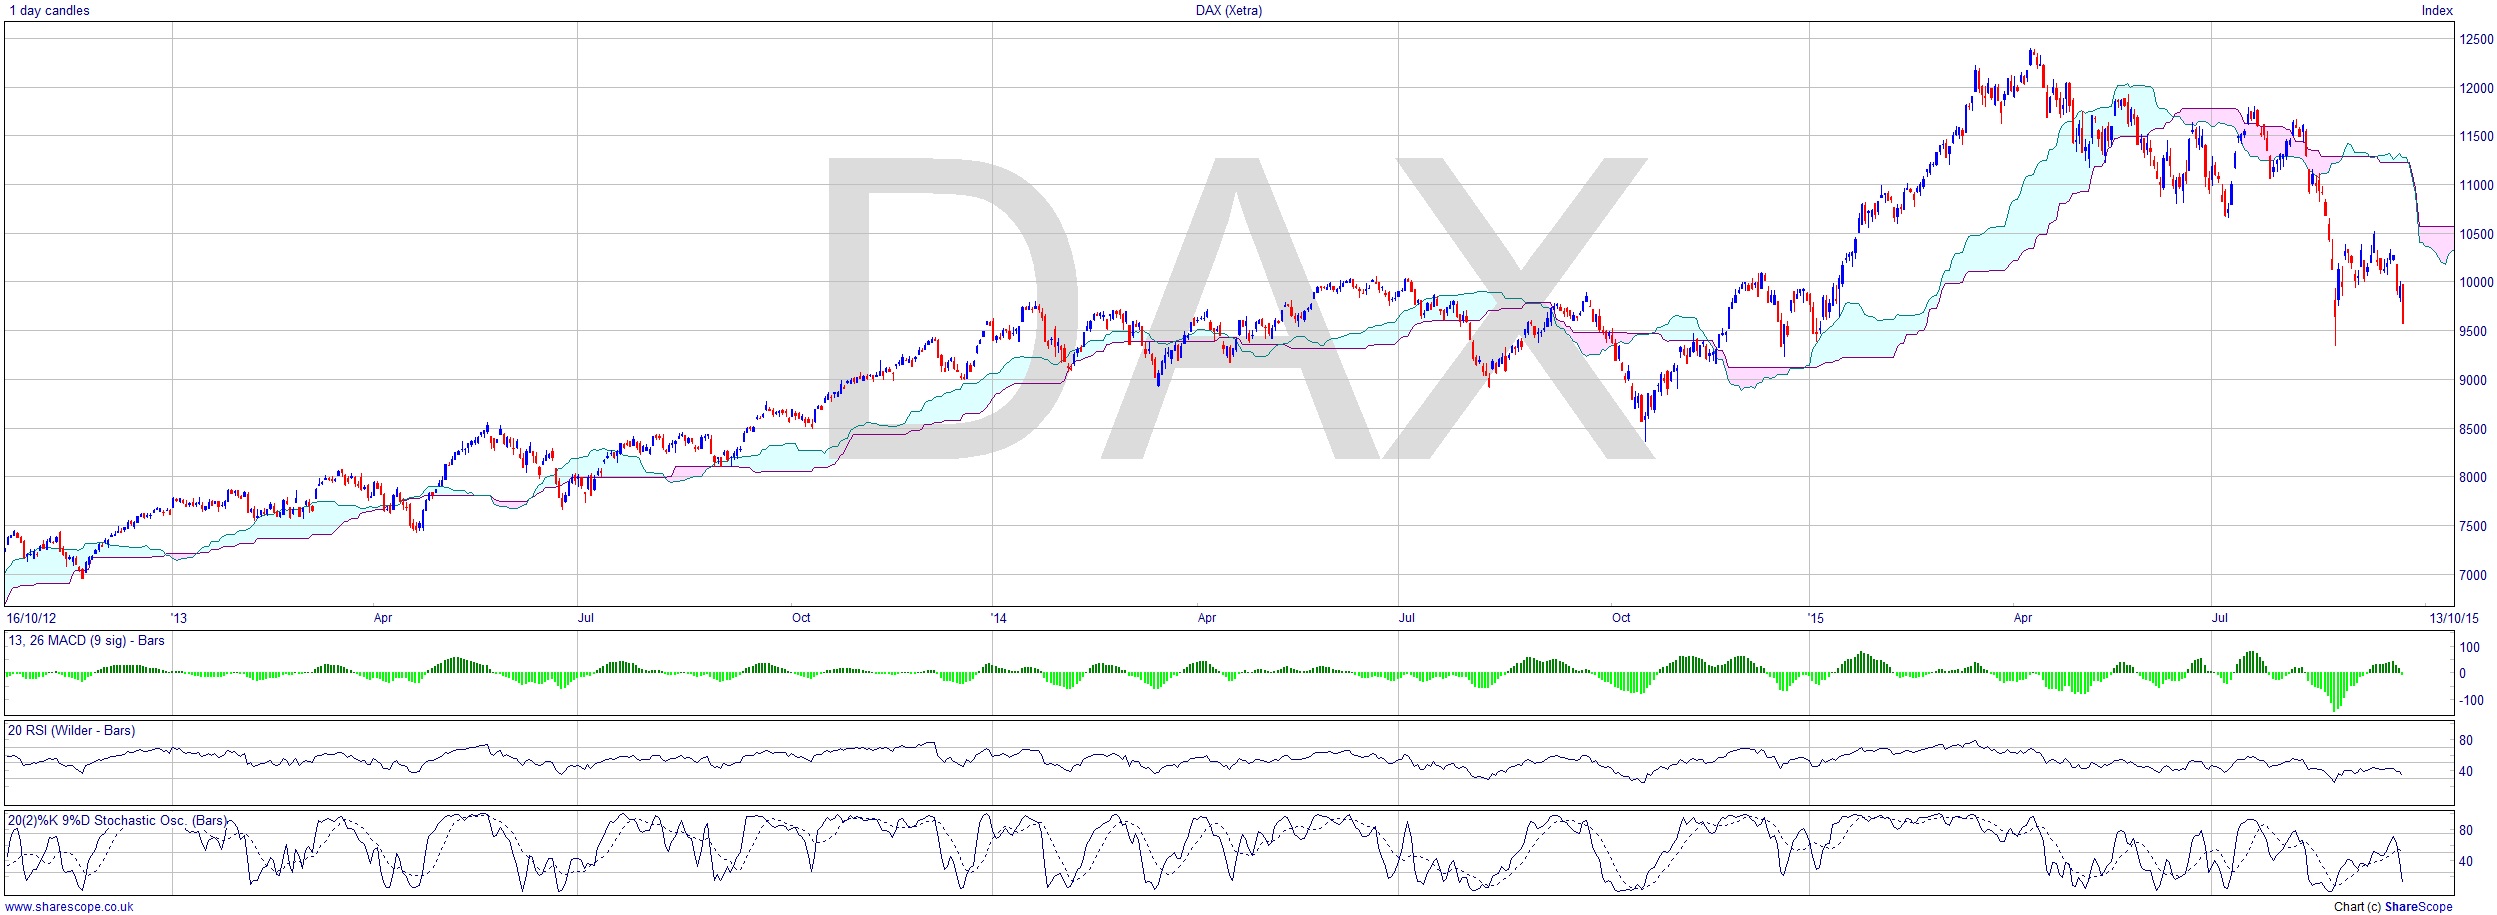
So let’s take the DAX. The H+S is not terrifically clear on the daily chart. In fact a lot of the left shoulder is a congestion area, which in the big scheme of things is meaningless in terms of price action. What the P+F does is to cut out that inaction and make the pattern much easier to see. P+F charts are non-linear in terms of time. You could have no change in a P+F chart for months and then a lot of action over a few days. It presents what we’re interested in for TA purposes, often far more clearly than a conventional linear price chart. I’ve marked the shoulders with big arrows. It could be argued there is a series of left shoulders but I’ve marked the last one.
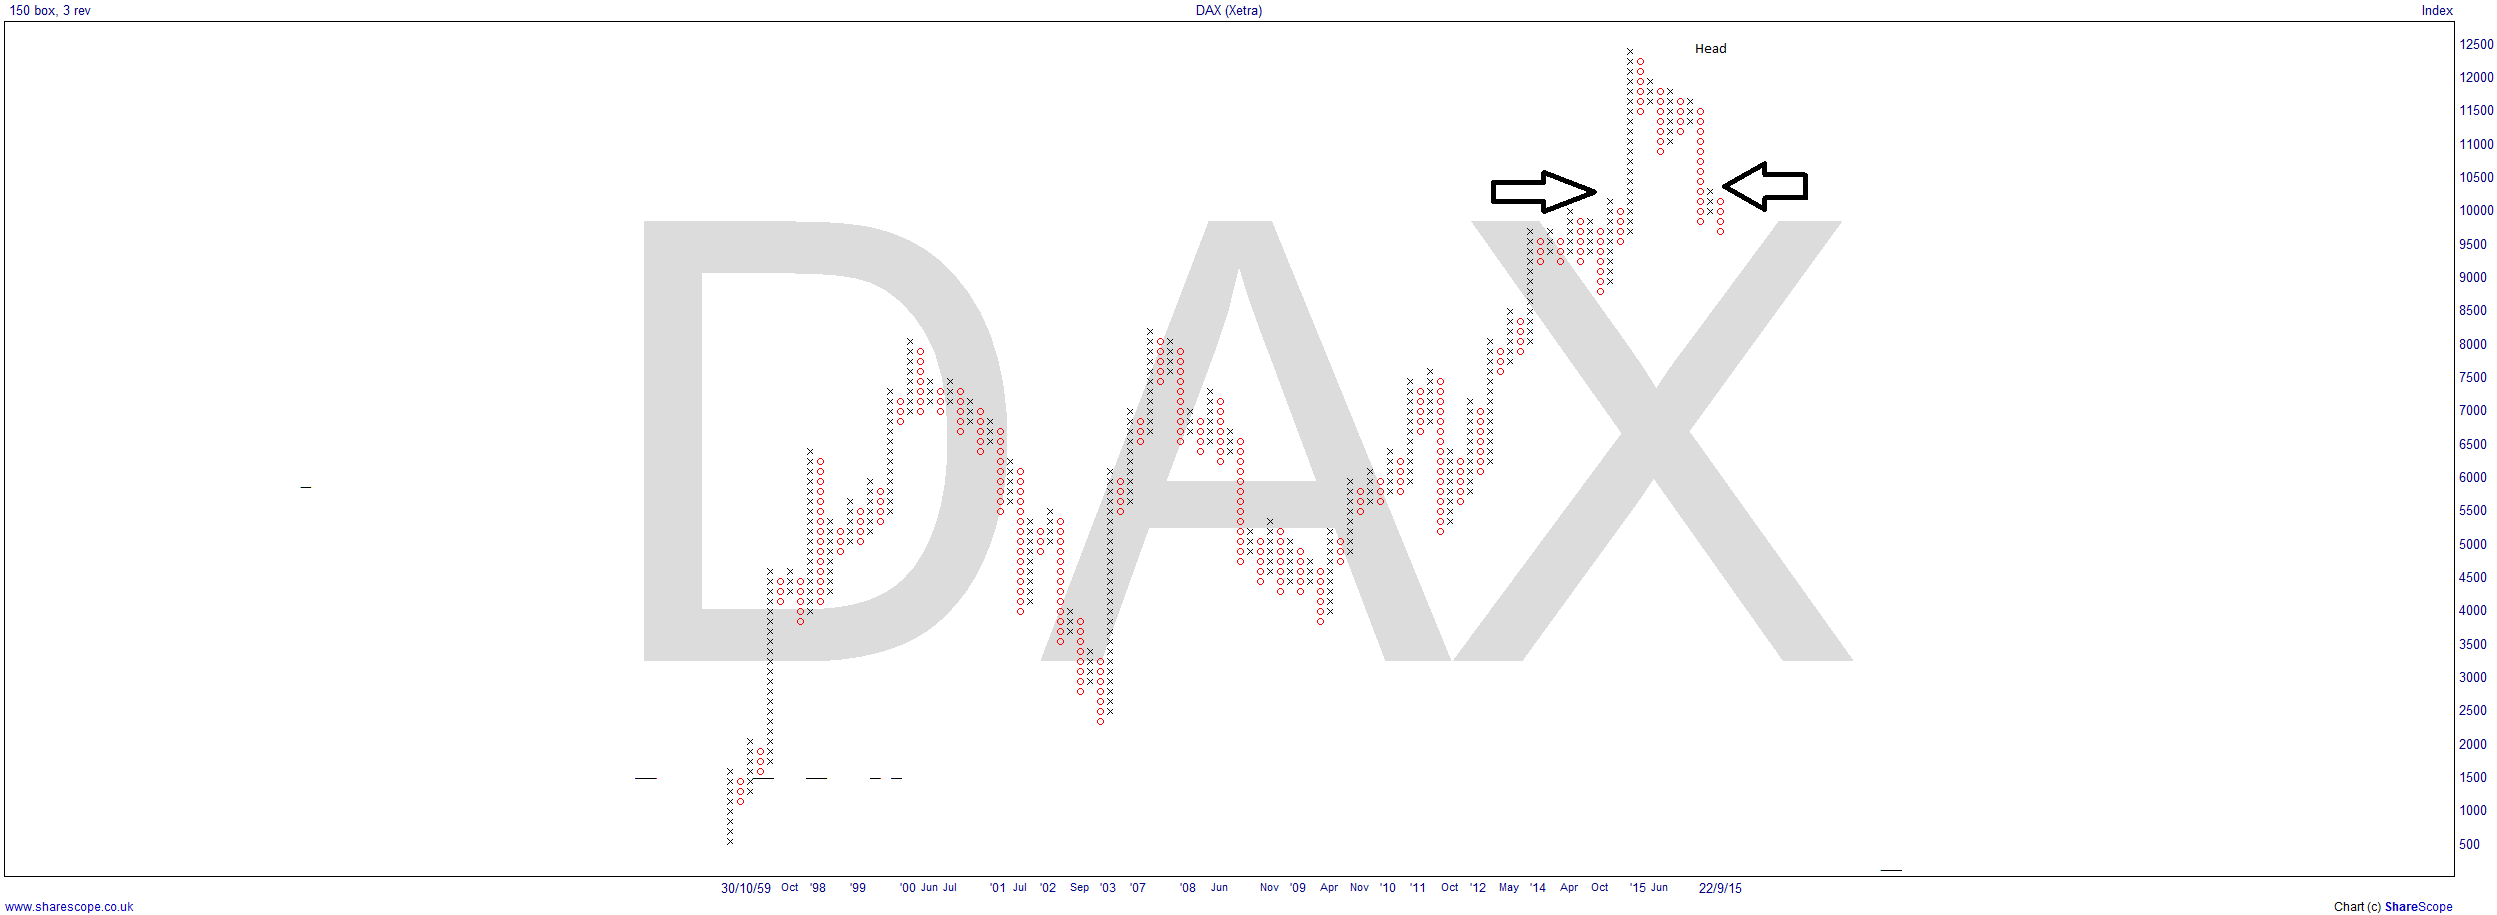
Falling below 10,000 again and creating that right shoulder, the fate of the DAX is now sealed. And if that’s the case then we don’t need to find such clear patterns in other main markets that are broadly mirroring the DAX, as they will all tend to suffer the same fate, things being as globally connected as they are these days. Remember that the DAX did slip into bear market numbers recently, as it fell over 20% from its high. So the DAX is already technically in a bear market. Now could be a good time to look at a short position and consider whether it’s reasonable to expect the price to fall to the neckline (if you can work out where the market will think it is).
As I said in my H+S article recently, shorting a H+S on the right shoulder, and before it reaches the neckline, provides insurance against a pattern failure. For the trade strategy to work it needs to have enough room to get into profit when it gets there (allowing for the Stop Loss). If it then rises from the neckline you’re either up a bit or you at least have a scratch trade (breakeven).
Comments (0)