Chart of the Day: Tesco

It would appear that everyone in the UK is an expert on the supermarket sector, even more so than the management of the companies in question, and of course even more so than one of the world’s greatest ever investors, Warren Buffett. He first invested in, and then bailed out of Tesco, describing the whole episode as an awful mistake. But at least he did not sell out at the bottom…
Tesco (TESCO): Gap Support towards 140p
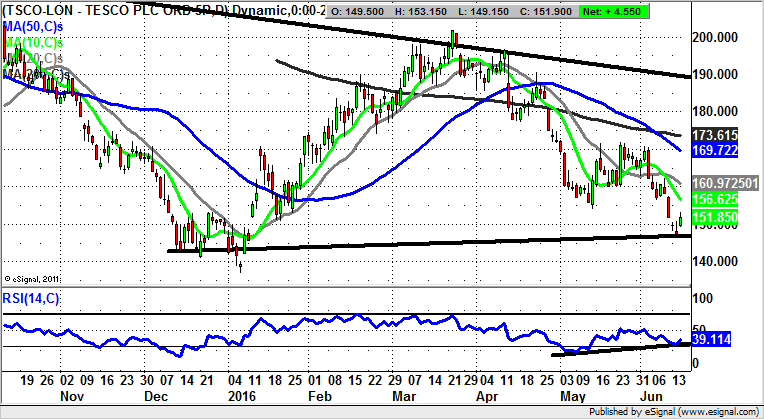
Looking at the daily chart of Tesco currently, and it would appear to be the kind of stock that a technical analyst might tell you to avoid if at all possible. This is because over much of the recent past there has been difficult price action where the shares have appeared to turn on a dime. A good example of this was at the start of the year with the gap back above the former December support in the 140p region in January. After this was an extended bull trap above the 200 day moving average for March/April. This ended with a fall back below the 200 day line, then at 180p, via an as yet unfilled gap to the downside. The present position shows how there has been clear bullish divergence in the RSI window in the wake of the two unfilled gaps to the downside so far this autumn. On this basis one would suggest we have a buying opportunity, at least while there is no break back below the floor of the 139.89p February gap floor. The target as long as this holds is the 50 day moving average, now at 169.72p, which offers decent upside even at present levels.

Comments (0)