Chart of the Day: Pantheon Resources

On the face of it, at least from the perspective of a non oil industry expert, the decline in Pantheon Resources was overdone. However, it may be the technical / charting position which investors should take note of.
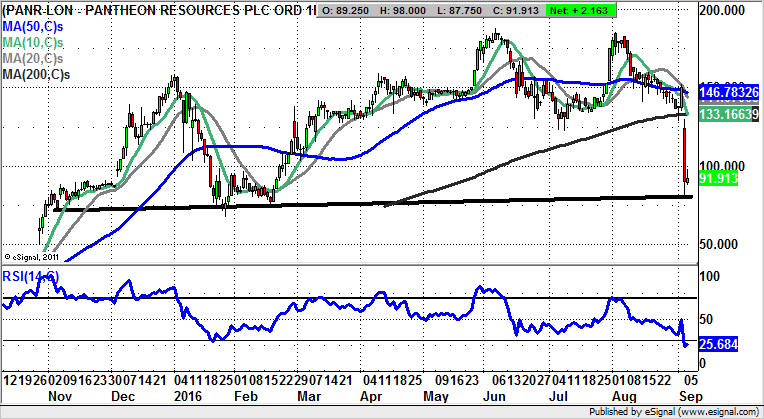
Pantheon Resources (PANR): Key 80p Support Zone
It would appear to some that the crash for Pantheon Resources shares to start the week was something of a storm in a teacup, with the failure of the horizontal well-drilling. However, historically one sees time and again how “hot” stocks punish their devotees extremely hard when things go awry, even when the issue is relatively modest. Perhaps at this stage it can be said that bulls of Pantheon should regard themselves as bloodies but as yet unbowed. Nevertheless, from a technical perspective on the daily chart, it can be seen how the market was certainly expecting a rebound from the then support area between 130p – 140p, rather than the near 50% decline. Luckily, to date, we see how the stock has found friends towards the main post November floor near 80p, and at least while this holds it may be prudent to sit on one’s hands rather than panick. But it is still the case that the gap down through the 200 day moving average was a warning that the fundamental position here has changed. No quick recovery of the 100p area would imply that even 80p solid support could be under threat / tested, before the big bull run here gets back underway.
Comments (0)