Chart of the Day: Glencore

We are still likely to be on the right track as far as expecting mining stocks of all shapes and sizes to do good things for the long haul. However, the aftermath of the bumper 287,000 Non Farm Payrolls number for June in the US may just slow things down for a while. Glencore is a case in point…
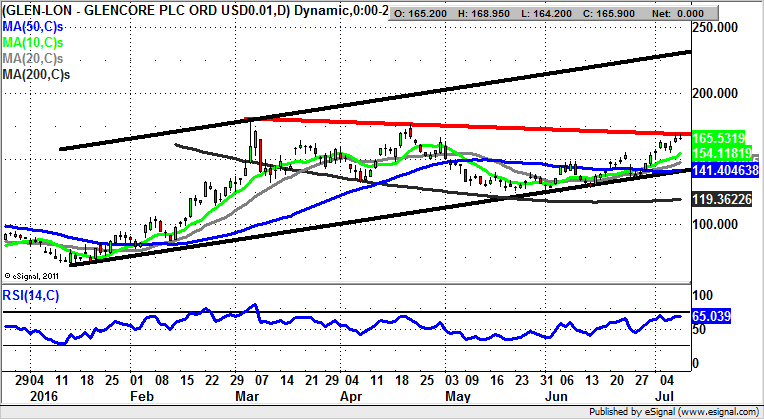
Glencore (GLEN): Initial 170p Zone Resistance
As far as the present charting set up at Glencore is concerned, it is very easy to take a bullish or indeed, a very bullish tack. This is particularly the case given the way we are trading in the wake of an extended U shaped basing by the shares at and above the 200 day moving average now at 119p and rising. All of this suggests that the stock is making an extended base above this key charting feature, and is threatening to deliver a new leg to the upside for later in the summer. This could be delivered by as little as an end of week close above a line of resistance from March currently running at 170p. The best way forward at this stage may be to wait for this momentum buy trigger, especially as the implication is that above 170p we could see Glencore shares accelerate quite quickly towards the March 180p peak. The big picture target here over the next 2-3 months is as high as the top of a rising trend channel from January at 230p. In the meantime, any dips towards the 10 day moving average at 154p could be regarded as bottom fishing opportunities for those who do not wish to buy towards the top of the recent range.
Comments (0)