Chart of the Day: GlaxoSmithkline

One of the standouts of the recent past, as far as the worlds of finance and politics are concerned, is how many of even the best rules and relationships have been rewritten. GlaxoSmithkline is currently doing this in a positive way.
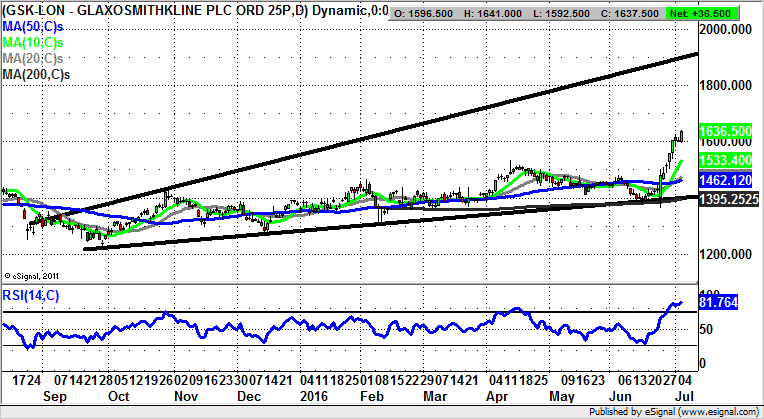
GlaxoSmithkline (GSK): The Elephant That Galloped
Most of us are familiar with the stock market cliché “Elephants don’t gallop”, which refers to the way so called blue chip stocks tend to move slowly both on the upside and the downside. In contrast, you could conceivably see a small cap stock quadruple or more within the space of a month. But the combination of being in a defensive sector, and a Dollar earner as the Pound plummets, looks to be working well for this pharmaceutical giant. Over the past couple of weeks there has been a near vertical recovery. This is currently leading to a consolidation close to the 1,600p zone. Provided there is no end of day close back below the 10 day moving average at 1,533p, we could be treated to a best case scenario target at 1,900p at an August 2015 resistance line projection over the next 1-2 months.
Comments (0)